更改 R 中 ggplot2 绘图的水平图例项之间的间距
在本文中,我们将了解如何使用 R 编程语言中的 ggplot2 条形图更改水平图例项之间的间距。
在这里,我们使用条形图,对任何其他图都可以这样做。为了创建一个简单的条形图,我们将使用函数geom_bar()。
Syntax:
geom_bar(stat, fill, color, width)
Parameters :
- stat : Set the stat parameter to identify the mode.
- fill : Represents color inside the bars.
- color : Represents color of outlines of the bars.
- width : Represents width of the bars.
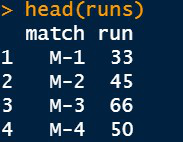
使用中的数据:
让我们首先创建一个规则图,以便差异明显。
例子:
R
# Bar Plot with Legend at bottom
library(ggplot2)

# Inserting data
runs <- data.frame(match=c("M-1","M-2","M-3","M-4"),
                   run=c(33, 45, 66, 50))

IPL <-ggplot(data=runs, aes(x=match, y=run,fill=match)) +
  coord_flip()+
  geom_bar(stat="identity")+
  theme_classic()+
  theme(legend.position = 'bottom')
IPL
R
library(ggplot2)

# Inserting data
runs <- data.frame(match=c("M-1","M-2","M-3","M-4"),
                   run=c(33, 45, 66, 50))

# spacing of 0.5 cm
IPL+theme(legend.spacing.x = unit(0.5,'cm'))

# spacing of 1 cm
IPL+theme(legend.spacing.x = unit(1,'cm'))
输出:
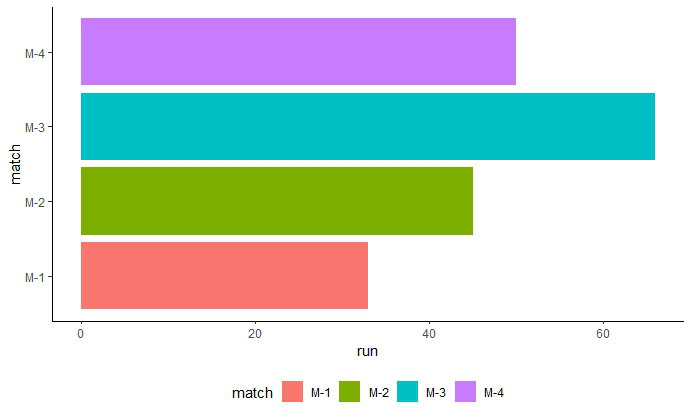
具有默认间距的图例
要更改水平图例之间的空间,我们必须使用以下命令:
legend.x = unit( unit_value, ‘cm’)
该命令必须写在theme()函数,我们之前已经在该函数中指定了图例的位置。
例子:
电阻
library(ggplot2)

# Inserting data
runs <- data.frame(match=c("M-1","M-2","M-3","M-4"),
                   run=c(33, 45, 66, 50))

# spacing of 0.5 cm
IPL+theme(legend.spacing.x = unit(0.5,'cm'))

# spacing of 1 cm
IPL+theme(legend.spacing.x = unit(1,'cm'))
输出:

图例间距为 0.5 厘米

图例,间距为 1 厘米