Python Bokeh – 在图表上绘制菱形十字
Bokeh 是一个Python交互式数据可视化。它使用 HTML 和 JavaScript 渲染其绘图。它针对现代 Web 浏览器进行演示,提供具有高性能交互性的新颖图形的优雅、简洁构造。
Bokeh 可用于在图表上绘制带有十字的菱形。可以使用plotting模块的diamond_cross()方法在图形上绘制带有十字的菱形。
plotting.figure.diamond_cross()
Syntax : diamond_cross(parameters)
Parameters :
- x : x-coordinates of the center of the diamond cross markers
- y : y-coordinates of the center of the diamond cross markers
- size : diameter of the diamond cross markers, default is 4
- angle : angle of rotation of the diamond cross markers, default is 0
- angle_units : unit of the angle, default is rad
- fill_alpha : fill alpha value of the diamond cross markers
- fill_color : fill color value of the diamond cross markers
- line_alpha : percentage value of line alpha, default is 1
- line_cap : value of line cap for the line, default is butt
- line_color : color of the line, default is black
- line_dash : value of line dash such as :
- solid
- dashed
- dotted
- dotdash
- dashdot
default is solid
- line_dash_offset : value of line dash offset, default is 0
- line_join : value of line join, default in bevel
- line_width : value of the width of the line, default is 1
- name : user-supplied name for the model
- tags : user-supplied values for the model
Other Parameters :
- alpha : sets all alpha keyword arguments at once
- color : sets all color keyword arguments at once
- legend_field : name of a column in the data source that should be used
- legend_group : name of a column in the data source that should be used
- legend_label : labels the legend entry
- muted : determines whether the glyph should be rendered as muted or not, default is False
- name : optional user-supplied name to attach to the renderer
- source : user-supplied data source
- view : view for filtering the data source
- visible : determines whether the glyph should be rendered or not, default is True
- x_range_name : name of an extra range to use for mapping x-coordinates
- y_range_name : name of an extra range to use for mapping y-coordinates
- level : specifies the render level order for this glyph
Returns : an object of class GlyphRenderer
示例 1:在此示例中,我们将使用默认值来绘制图形。我们提供了 size 和 fill_color 属性以使字形可见。
# importing the modules
from bokeh.plotting import figure, output_file, show

# file to save the model
output_file("gfg.html")

# instantiating the figure object
graph = figure(title = "Bokeh Diamond Cross Graph")

# the points to be plotted
x = [-5, -4, -3, -2, -1, 0, 1, 2, 3, 4, 5]
y = [i ** 2 for i in x]

# plotting the graph
graph.diamond_cross(x, y, size = 25, fill_color = None)

# displaying the model
show(graph)
输出 : 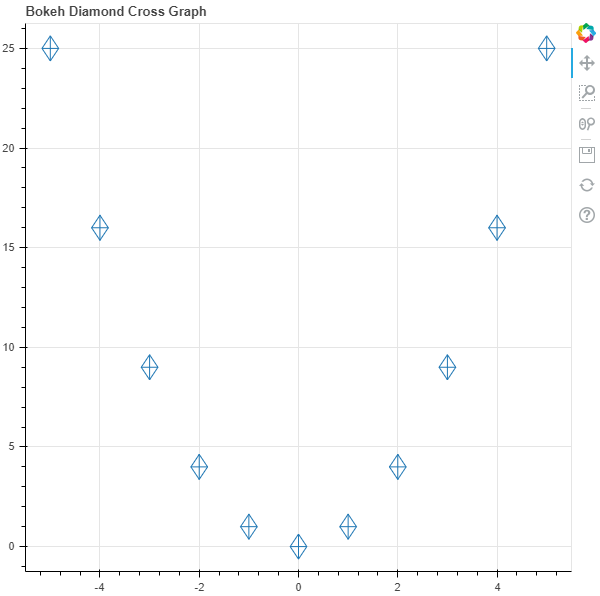
示例 2:在此示例中,我们将在其他参数旁边用虚线绘制菱形十字架,菱形十字架的大小与其值成正比。
# importing the modules
from bokeh.plotting import figure, output_file, show

# file to save the model
output_file("gfg.html")

# instantiating the figure object
graph = figure(title = "Bokeh Diamond Cross Graph")

# name of the x-axis
graph.xaxis.axis_label = "x-axis"

# name of the y-axis
graph.yaxis.axis_label = "y-axis"

# the points to be plotted
x = [-5, -4, -3, -2, -1, 0, 1, 2, 3, 4, 5]
y = [i ** 2 for i in x]

# size of the diamonds
size = [i * 2 for i in y]

# angle of the diamonds
angle = 10

# fill color value
fill_color = None

# color of the line
line_color = "red"

# type of line
line_dash = "dotted"

# offset of line dash
line_dash_offset = 1

# width of the dashes
line_width = 10

# name of the legend
legend_label = "Sample Dashes"

# plotting the graph
graph.diamond_cross(x, y,
                    size = size,
                    angle = angle,
                    fill_color = fill_color,
                    line_color = line_color,
                    line_dash = line_dash,
                    line_dash_offset = line_dash_offset,
                    line_width = line_width,
                    legend_label = legend_label)


# displaying the model
show(graph)
输出 : 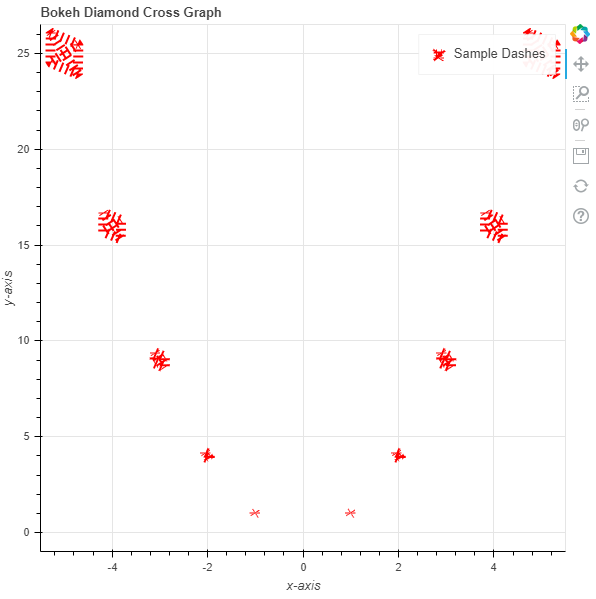
在评论中写代码?请使用 ide.geeksforgeeks.org,生成链接并在此处分享链接。