相关系数公式
相关系数用于计算两个变量之间连接的重要性。有不同类型的相关系数,其中最流行的是皮尔逊相关系数(也称为皮尔逊 R),它常用于线性回归。
相关系数公式
相关系数过程用于确定数据之间的关系有多强。相关系数过程产生一个介于 1 和 -1 之间的值。其中,
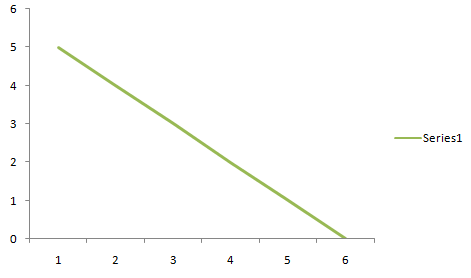
- -1 表示强烈的负相关
- 1 表示强烈的正向关系
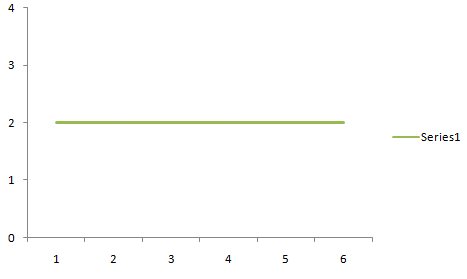
- 结果为零意味着根本没有联系

Positive Correlation

Negative Correlation

Zero Correlation
意义
- 相关系数为 -1 意味着对于一个变量的每一个正增加,都会有一个固定比例的负减少。就像,罐中的气体量与速度完全相关。
- 相关系数为 1 意味着对于一个变量的每一个正增长,其他固定比例的正增长。就像,鞋子的尺寸与脚的长度完全相关。
- 零意味着对于每次增加,既没有正增加也没有负增加。两者只是没有关系。
公式类型
- 皮尔逊相关系数公式
- 样本相关系数公式
![]()
![]()
Sxy is the sample Covariance, and Sx and Sy are the sample standard deviations
- 人口相关系数公式
![]()
![]()
It uses σx and σy as the population standard deviation and, σxy as the population Covariance.
皮尔逊相关性
它是统计学中最常见的相关性。全称是Pearson's Product Moment correlation,简称PPMC。它显示了两组数据之间的线性关系。两个字母用于表示 Pearson 相关性:希腊字母 rho (ρ) 表示总体,字母“r”表示样本相关系数。
求 Pearson 相关系数的步骤
Step 1: Firstly make a chart with the given data like subject,x, and y and add three more columns in it xy, x² and y².
Step 2: Now multiply the x and y columns to fill the xy column. For example:- in x we have 24 and in y we have 65 so xy will be 24×65=1560.
Step 3: Now, take the square of the numbers in the x column and fill the x² column.
Step 4: Now, take the square of the numbers in the y column and fill the y² column.
Step 5: Now, add up all the values in the columns and put the result at the bottom. Greek letter sigma (Σ) is the short way of saying summation.
Step 6: Now, use the formula for Pearson’s correlation coefficient:
![Rendered by QuickLaTeX.com R= \frac{n(∑xy) - (∑x)(∑y)}{\sqrt{[n∑x²-(∑x)²][n∑y²-(∑y)²}}](https://mangodoc.oss-cn-beijing.aliyuncs.com/geek8geeks/Correlation_Coefficient_Formula_9.jpg)
To know which type of variable we have either positive or negative.
线性相关系数
Pearson 相关系数是线性相关系数,它返回介于 -1 和 +1 之间的值。其中,-1 表示强负相关,+1 表示强正相关。如果它位于 0 则没有相关性。这也称为零相关。
使用 Pearson 相关性分析相关性稳定性的“粗略估计”:r value crude estimates +.70 or higher A very strong positive relationship +.40 to +.69 Strong positive relationship +.30 to +.39. Moderate positive relationship +.20 to +.29 weak positive relationship +.01 to +.19 No or negligible relationship 0 No relationship [zero correlation] -.01 to -.19 No or negligible relationship -.20 to -.29 weak negative relationship -.30 to -.39 Moderate negative relationship -.40 to -.69 Strong negative relationship -.70 or higher The very strong negative relationship
Cramer 的 V 相关性
它与皮尔逊相关系数相似。它用于计算超过 2×2 行和列的相关性。 Cramer 的 V 相关性在 0 和 1 之间变化。接近零的值表示变量之间存在非常小的关联,如果接近 1,则表明关联非常强。
使用 Cramer 的 V 相关性解释相关性强度的“粗略估计”:Cramer’s V crude estimates .25 or higher Very strong relationship .15 to .25 Strong relationship .11 to .15 Moderate relationship .06 to .10 weak relationship .01 to .05 No or negligible relationship
示例问题
问题1:根据下表计算相关系数:SUBJECT AGE X GLUCOSE LEVEL Y 1 42 98 2 23 68 3 22 73 4 47 79 5 50 88 6 60 82
解决方案:
Make a table from the given data and add three more columns of XY, X², and Y².
∑xy = 20379
∑x = 244
∑y = 488
∑x² = 11086
∑y² = 40266
n = 6.
Put all the values in the Pearson’s correlation coefficient formula:
![Rendered by QuickLaTeX.com R= \frac{n(∑xy) - (∑x)(∑y)}{\sqrt{[n∑x²-(∑x)²][n∑y²-(∑y)²}}](https://mangodoc.oss-cn-beijing.aliyuncs.com/geek8geeks/Correlation_Coefficient_Formula_10.jpg)
R = 6(20379) – (244)(488) / √[6(11086)-(244)²][6(40266)-(488)² ]
R = 3202 / √[6980][3452]
R = 3202/4972.238
R = 0.6439
It shows that the relationship between the variables of the data is a strong positive relationship.
问题2:根据下表计算相关系数:SUBJECT AGE X GLUCOSE LEVEL Y XY X² Y² 1 42 98 4116 1764 9604 2 23 68 1564 529 4624 3 22 73 1606 484 5329 4 47 79 3713 2209 6241 5 50 88 4400 2500 7744 6 60 82 4980 3600 6724 ∑ 244 488 20379 11086 40266
解决方案:
Make a table from the given data and add three more columns of XY, X², and Y².SUBJECT AGE X Weight Y XY X² Y² 1 40 99 3960 1600 9801 2 25 79 1975 625 6241 3 22 69 1518 484 4761 4 54 89 4806 2916 7921 ∑ 151 336 12259 5625 28724
∑xy = 12258
∑x = 151
∑y = 336
∑x² = 5625
∑y² 28724
n = 4
Put all the values in the Pearson’s correlation coefficient formula:
![Rendered by QuickLaTeX.com R= \frac{n(∑xy) - (∑x)(∑y)}{\sqrt{[n∑x²-(∑x)²][n∑y²-(∑y)²}}](https://mangodoc.oss-cn-beijing.aliyuncs.com/geek8geeks/Correlation_Coefficient_Formula_11.jpg)
R = 4(12258) – (151)(336) / √[4(5625)-(151)²][4(28724)-(336)²]
R = -1704 / √[-301][-2000]
R=-1704/775.886
R=-2.1961
It shows that the relationship between the variables of the data is a very strong negative relationship.
问题3:计算以下数据的相关系数:
X = 7,9,14 和 Y = 17,19,21
解决方案:
Given variables are,
X = 7,9,14
and,
Y = 17,19,21
To, find the correlation coefficient of the following variables Firstly a table is to be constructed as follows, to get the values required in the formula.X Y XY X² Y² 7 17 119 49 36 9 19 171 81 361 14 21 294 196 441 ∑ 30 ∑ 57 ∑ 584 ∑ 326 ∑ 838
∑xy = 584
∑x = 30
∑y = 57
∑x² = 326
∑y² = 838
n = 3
Put all the values in the Pearson’s correlation coefficient formula:
![Rendered by QuickLaTeX.com R= \frac{n(∑xy) - (∑x)(∑y)}{\sqrt{[n∑x²-(∑x)²][n∑y²-(∑y)²}}](https://mangodoc.oss-cn-beijing.aliyuncs.com/geek8geeks/Correlation_Coefficient_Formula_12.jpg)
R = 3(584) – (30)(57) / √[3(326)-(30)²][3(838)-(57)²]
R = 42 / √[78][-735]
R = 42/-239.43
R = -0.1754
It shows that the relationship between the variables of the data is negligible relationship
问题4:计算以下数据的相关系数:
X = 21、31、25、40、47、38 和 Y = 70、55、60、78、66、80
解决方案:
Given variables are,
X = 21,31,25,40,47,38
And,
Y = 70,55,60,78,66,80
To, find the correlation coefficient of the following variables Firstly a table is to be constructed as follows, to get the values required in the formula.X Y XY X² Y² 21 70 1470 441 4900 31 55 1705 961 3025 25 60 1500 625 3600 40 78 3120 1600 6094 47 66 3102 2209 4356 38 80 3040 1444 6400 ∑202 ∑409 ∑13937 ∑7280 ∑28265
∑xy = 13937
∑x = 202
∑y = 409
∑x² = 7280
∑y² = 28265
n = 6
Put all the values in the Pearson’s correlation coefficient formula:
![Rendered by QuickLaTeX.com R= \frac{n(∑xy) - (∑x)(∑y)}{\sqrt{[n∑x²-(∑x)²][n∑y²-(∑y)²}}](https://mangodoc.oss-cn-beijing.aliyuncs.com/geek8geeks/Correlation_Coefficient_Formula_13.jpg)
R = 6(13937) – (202)(409) / √[6(7280) – (202)²][6(28265) – (409)²]
R = 1004 /√[2876][2909]
R = 1004 / 2892.452938
R = 0.3471
It shows that the relationship between the variables of the data is a moderate positive relationship.
问题5:计算以下数据的相关系数?
X = 5 ,9 ,14, 16 和 Y = 6, 10, 16, 20 。
解决方案:
Given variables are,
X = 5 ,9 ,14, 16
And
Y = 6, 10, 16, 20.
To, find the correlation coefficient of the following variables Firstly a table is to be constructed as follows, to get the values required in the formula add all the values in the columns to get the values used in the formulaX Y XY X² Y² 5 6 30 25 36 9 10 90 81 100 14 16 224 196 256 16 20 320 256 400 ∑44 ∑52 ∑664 ∑558 ∑792
∑xy = 664
∑x = 44
∑y = 52
∑x² = 558
∑y² = 792
n = 4
Put all the values in the Pearson’s correlation coefficient formula:
![]()
R = 4(664) – (44)(52) / √[4(558) – (44)²][4(792) – (52)²]
R = 368 / √[296][464]
R = 368/370.599
R = 0.9930
It shows that the relationship between the variables of the data is a very strong positive relationship.
问题 6:计算以下数据的相关系数:
X = 10, 13, 15 ,17 ,19 和 Y = 5,10,15,20,25。
解决方案:
Given variables are,
X = 10, 13, 15 ,17 ,19 and Y = 5, 10, 15, 20, 25.
To, find the correlation coefficient of the following variables Firstly a table is to be constructed as follows, to get the values required in the formula also add all the values in the columns to get the values used in formula,X Y XY X² Y² 10 5 50 100 25 13 10 130 169 100 15 15 225 225 225 17 20 340 340 400 19 25 475 475 625 ∑74 ∑75 ∑1103 ∑1144 ∑1375
∑xy = 1103
∑x = 74
∑y = 75
∑x² = 1144
∑y² = 1375
n = 5
Put all the values in the Pearson’s correlation coefficient formula:
![Rendered by QuickLaTeX.com R= \frac{n(∑xy) - (∑x)(∑y)}{\sqrt{[n∑x²-(∑x)²][n∑y²-(∑y)²}}](https://mangodoc.oss-cn-beijing.aliyuncs.com/geek8geeks/Correlation_Coefficient_Formula_15.jpg)
R = 5(1103) – (74)(75) / √ [5(1144) – (74)²][5(1375) – (75)²]
R = -35 / √[244][1250]
R = -35/552.26
R = 0.0633
It shows that the relationship between the variables of the data is a negligible relationship.
习题7:计算下列数据的相关系数:
X = 12、10、42、27、35、56 和 Y = 13、15、56、34、65、26
解决方案:
Given variables are,
X = 12, 10, 42, 27, 35, 56 and Y = 13, 15, 56, 34, 65, 26
To, find the correlation coefficient of the following variables Firstly a table is to be constructed as follows, to get the values required in the formula also add all the values in the columns to get the values used in the formulaX Y XY X² Y² 12 13 156 144 169 10 15 150 100 225 42 56 2352 1764 3136 27 34 918 729 1156 35 65 2275 1225 4225 56 26 1456 3136 676 ∑182 ∑209 ∑7307 ∑7098 ∑9587
∑xy = 7307
∑x = 182
∑y = 209
∑x² = 7098
∑y² = 9587
n = 6
Put all the values in the Pearson’s correlation coefficient formula:
![Rendered by QuickLaTeX.com R= \frac{n(∑xy) - (∑x)(∑y)}{\sqrt{[n∑x²-(∑x)²][n∑y²-(∑y)²}}](https://mangodoc.oss-cn-beijing.aliyuncs.com/geek8geeks/Correlation_Coefficient_Formula_16.jpg)
R = 6(7307) – (182)(209) / √ {[6(7098) – (182)²][6(9587)-(209)²]}
R = 5804 / √[9464][13841]
R = 5804/11445.139
R = 0.5071
It shows that the relationship between the variables of the data is a strong positive relationship.
![Rendered by QuickLaTeX.com R= \frac{n(∑xy) - (∑x)(∑y)}{\sqrt{[n∑x²-(∑x)²][n∑y²-(∑y)²}}](https://mangodoc.oss-cn-beijing.aliyuncs.com/geek8geeks/Correlation_Coefficient_Formula_3.jpg)