R编程中设置或查看图形调色板——palette()函数
在本文中,我们将了解如何在 R 编程语言中设置或查看图形调色板。
R - 调色板()函数
R 语言中的palette()函数用于设置或查看图形调色板。
Syntax: palette(value)
Parameters:
value: an optional character vector.
示例 1:
R
# R program to illustrate
# palette function

# Calling the palette() function
# to obtain the current palette
palette()
R
# R program to illustrate
# palette function

# Calling the palette() function
# to set 2 extra Graphics Palette
palette(c(palette(), "purple", "brown"))

# Viewing the final added Graphics Palette
palette()
R
colors <- c("#A7A7A7",
 "forestgreen",
 "gold")

pie(discoveries, col = colors)
输出:
[1] "black"   "red"     "green3"  "blue"    "cyan"    "magenta" "yellow"
[8] "gray"
示例 2:
R
# R program to illustrate
# palette function

# Calling the palette() function
# to set 2 extra Graphics Palette
palette(c(palette(), "purple", "brown"))

# Viewing the final added Graphics Palette
palette()
输出:
[1] "black"   "red"     "green3"  "blue"    "cyan"    "magenta" "yellow"
[8] "gray"    "purple"  "brown"
定义自己的调色板
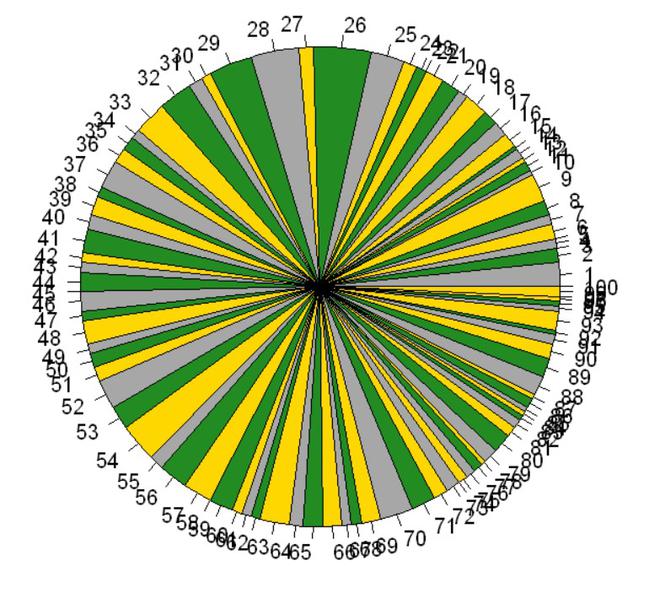
在这里,我们将制作自己的调色板,为此,我们将制作矢量以及十六进制三元组和 R 颜色名称,然后使用这些颜色名称绘制图表。
R
colors <- c("#A7A7A7",
 "forestgreen",
 "gold")

pie(discoveries, col = colors)
输出:
