在 R 编程中使用 Facebook Prophet 进行时间序列分析
时间序列分析是一种分析和学习数据集在一段时间内的行为的方法。此外,它通过在图表上绘制时间序列对象来帮助学习数据集的行为。在 R 编程中,可以使用ts()函数轻松执行,该函数获取数据向量并将其转换为函数参数中指定的时间序列对象。
Facebook Prophet 是 Facebook 开发的用于预测时间序列对象或数据的工具。它通过预测价格、销售或天气来帮助企业了解其产品的行为。 Facebook Prophet 工具基于可分解模型,即趋势、季节性和假期,有助于在这些约束条件下制作更准确的预测模型。它比 ARIMA 模型好得多,因为它有助于调整和调整输入参数。
先知模型的数学方程
![]()
where,
y(t) refers to the forecast
g(t) refers to the trend
s(t) refers to the seasonality
h(t) refers to the holidays for the forecast
e(t) refers to the error term while forecasting
Facebook Prophet 模型中使用的一些重要术语
- 趋势
趋势是在递增或递减方向上的发展转变。数学上,
where,
C indicates the carry capacity
k indicates the growth
m indicates the offset parameter - 季节性
季节性是时间序列对象在特定时间/季节发生并改变趋势的特征。 - 节假日
假期是一个对业务发生很大变化的时间段。它可以根据业务获利或亏损。
R中的实现
在下面的示例中,让我们下载数据集 AirPassengers 并使用 Facebook Prophet 模型执行数据集的预测。执行整个代码后,模型将显示预测值以及业务的趋势和季节性。
第 1 步:安装所需的库
# Install the library
install.packages("prophet")
第 2 步:加载所需的库
# Load the library
library(prophet)
第 3 步:从此处下载数据集 AirPassengers
# Dataset
ap <- read.csv("example_air_passengers.csv")
第 4 步:调用预测函数以拟合模型
m <- prophet(ap)
第 5 步:做出预测
# Predictions
future <- make_future_dataframe(m,
                    periods = 365)

# Print predictions
cat("\nPredictions:\n")
tail(future)
输出:
Predictions:
        ds
504 1961-11-26
505 1961-11-27
506 1961-11-28
507 1961-11-29
508 1961-11-30
509 1961-12-01
第 6 步:使用预测预测数据
# Forecast
forecast <- predict(m, future)
tail(forecast[c('ds', 'yhat',
    'yhat_lower', 'yhat_upper')])
ds         yhat    yhat_lower yhat_upper
504 1961-11-26 497.2056   468.6301   525.7918
505 1961-11-27 496.0703   467.8579   525.6728
506 1961-11-28 493.1698   465.5788   522.9650
507 1961-11-29 496.0497   469.2889   524.6313
508 1961-11-30 492.8452   463.7279   520.4519
509 1961-12-01 493.6417   466.3496   522.9887
第 7 步:绘制预测图
# Output to be present
# As PNG file
png(file = "facebookprophetGFG.png")

# Plot
plot(m, forecast)

# Saving the file
dev.off()
输出: 
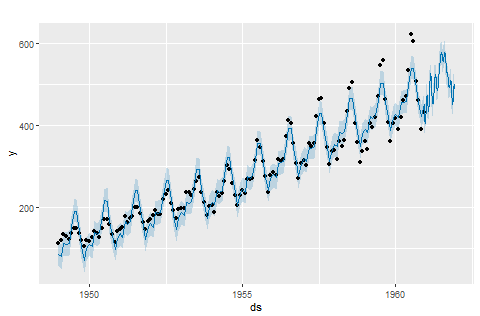
上图为 AirPassengers 的预测值,其中黑点表示原始数据,深蓝色线表示预测值(yhat),浅蓝色区域表示 yhat_upper 和 yhat_lower 值。
第 8 步:绘制趋势、每周和每年的季节性
# Output to be present
# As PNG file
png(file = "facebookprophettrendGFG.png")

# Plot
prophet_plot_components(m, forecast)

# Saving the file
dev.off()
输出: 
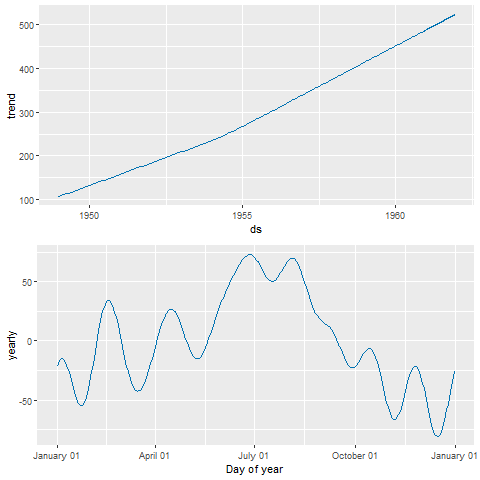
上图显示了在给定时间段内航空乘客增加的数据集的趋势。在第二张图中,它显示了数据集在一段时间内(即每年)的季节性,并表示航空乘客在 6 月至 8 月之间的月份中最多。