📜  在 Django 应用程序中集成散景可视化

📅  最后修改于: 2022-05-13 01:55:23.910000             🧑  作者: Mango

在 Django 应用程序中集成散景可视化

Bokeh 是一个交互式可视化库,可帮助我们创建数据集的可视化表示并与之交互。您可以创建各种类型的可视化,例如条形图、水平图、时间序列等。有多种方法可以将 Bokeh 应用程序和小部件包含到 Web 应用程序和页面中。

在本教程中,我们将创建一个基本的散景图并将其嵌入到我们的 Django Web 应用程序中。为此,我们将从bokeh.embed导入组件,它返回单个组件。函数bokeh.embed.components()返回一个脚本,该脚本包含带有

标签的绘图数据,其中加载了绘图视图。我们将详细了解分步过程。

第 1 步:设置一个基本的 Django 项目

对于这个项目,我们使用 PyCharm IDE。 PyCharm 是用于Python脚本语言的最流行的 IDE 之一。

  • 打开 PyCharm 并创建一个新项目并将其保存为 BokehProject。
  • 转到终端并使用以下命令安装 Django:
pip install django
  • 以同样的方式,我们将在我们的项目中安装散景:
pip install bokeh

第 2 步:创建 Django 项目

  • 使用以下命令创建一个 Django 项目:
django-admin startproject BokehDjango
  • 使用以下命令更改项目文件夹:
cd BokehDjango
  • 运行 manage.py 以使用 migrate 将数据更改最初迁移到我们的项目,如下所示
python manage.py migrate
  • 使用以下命令创建超级用户以创建超级用户帐户
python manage.py createsuperuser  
  • 添加姓名、电子邮件和密码。
  • 在这个阶段,目录结构如下图所示:

  • 现在让我们运行下面的命令来检查 Django 是否安装成功。
python manage.py runserver
  • 导航到地址 http://127.0.0.1:8000/,您将看到类似这样的内容。


  • 现在我们使用以下命令创建一个 Django 应用程序
python manage.py startapp BokehApp
  • 此阶段的目录结构如下图所示:

  • 由于我们已经创建了一个应用程序,因此我们需要将其添加到设置中。打开 settings.py 并在已安装的应用程序中添加以下内容:
INSTALLED_APPS = [
   'django.contrib.admin',
   'django.contrib.auth',
   'django.contrib.contenttypes',
   'django.contrib.sessions',
   'django.contrib.messages',
   'django.contrib.staticfiles',
   'BokehApp',
]
  • 更新 urls.py 文件并添加 URL 模式。从我们的项目文件夹即 BokehDjango 打开urls.py ,并在 import 语句中添加 include函数。此外,添加路径以包含我们新应用程序的 URL,如下所示:
Python
from django.contrib import admin
from django.urls import path, include
 
 
urlpatterns = [
    path("admin/", admin.site.urls),
    path("", include("BokehApp.urls")),
]


Python
from django.urls import path
from . import views
 
urlpatterns = [path("", views.home, name="home")]


Python
from django.shortcuts import render
from django.http import HttpResponse
 
# Create your views here.
def home(request):
    return HttpResponse("Welcome to home page")

HTML


HTML


HTML


Our first Bokeh Graph

      {{div| safe}}                        {{script| safe}}


Python
from django.shortcuts import render
from django.http import HttpResponse
from bokeh.plotting import figure
from bokeh.embed import components
 
# Create your views here.
 
def home(request):
 
   #create a plot
    plot = figure(plot_width=400, plot_height=400)
 
   # add a circle renderer with a size, color, and alpha
 
   plot.circle([1, 2, 3, 4, 5], [6, 7, 2, 4, 5], size=20, color="navy", alpha=0.5)
 
   script, div = components(plot)
 
   return render(request, 'base.html', {'script': script, 'div': div})


HTML


Data Visualization using Bokeh and Django


Bokeh is a data                   visualization library for Python. Unlike Matplotlib and                   Seaborn, they are also Python packages for data visualization,                   Bokeh renders its plots using HTML and                   JavaScript. Hence, it proves to be extremely useful                   for developing web based dashboards.                   The Bokeh project is sponsored by NumFocus                   https://numfocus.org/. NumFocus also supports PyData, an                   educational program, involved in development of                   important tools such as NumPy, Pandas and more.                   Bokeh can easily connect with these tools and                   produce interactive plots, dashboards and data applications.                   Features                   Bokeh primarily converts the data source into a JSON file                   which is used as input for BokehJS, a JavaScript library,                   which in turn is written in TypeScript and renders the                   visualizations in modern browsers.                   Some of the important features of Bokeh are as follows −                   Flexibility                   Bokeh is useful for common plotting requirements as                   well as custom and complex use-cases.                   Productivity                   Bokeh can easily interact with other popular Pydata                   tools such as Pandas and Jupyter notebook.                   Interactivity                   This is an important advantage of Bokeh over Matplotlib and                   Seaborn, both produce static plots. Bokeh                   creates interactive plots that change when the user                   interacts with them. You can give your audience a                   wide range of options and tools for inferring and                   looking at data from various angles so that user can                   perform “what if” analysis.                   Powerful                   By adding custom JavaScript, it is possible to generate                   visualizations for specialised use-cases.                   Sharable                   Plots can be embedded in output of Flask or Django                   enabled web applications. They can also be rendered in                   Jupyter notebooks.                   Open source                   Bokeh is an open source project. It is distributed under                   Berkeley Source Distribution (BSD) license. Its                   source code is available on https://github.com/bokeh/bokeh                


Simple Bokeh Graph

                  {{ div| safe}}                


                              {{script| safe}}


  • 现在在我们的应用程序文件夹中创建一个新文件,即 BokehApp,并将其保存为urls.py。
  • 打开文件并添加如下所示的主页路由路径,也不要忘记导入路径和视图。

Python

from django.urls import path
from . import views
 
urlpatterns = [path("", views.home, name="home")]
  • 接下来,我们为我们的主页创建视图,它将呈现我们的第一个散景图。打开 views.py 并创建一个名为home()的新方法,在此之前我们导入 HttpResponse..HttpResponse 最常用作 Django 视图的返回对象。
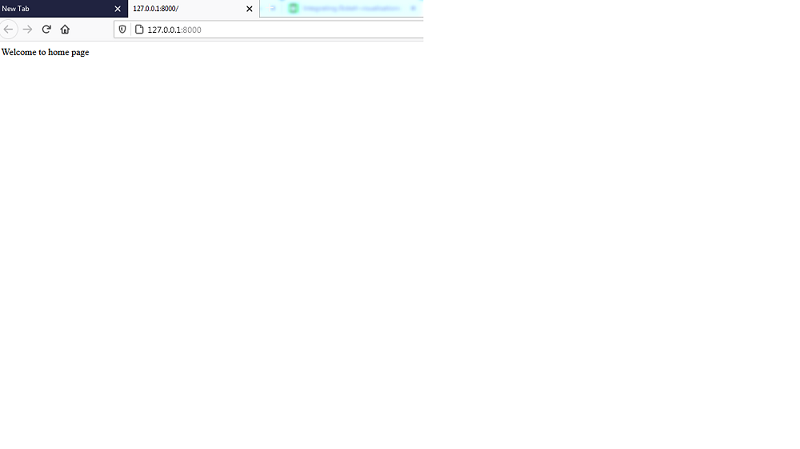
  • 截至目前,我们只是显示一条欢迎消息,如下所示:

Python

from django.shortcuts import render
from django.http import HttpResponse
 
# Create your views here.
def home(request):
    return HttpResponse("Welcome to home page")


  • 让我们使用Python manage.py runserver 运行服务器并查看结果:

伟大的!所以这就是设置我们的 Django 网站。


第 3 步:在我们的项目中完成散景设置:

  • 转到您的Python shell 并检查 Bokeh 的版本为:
bokeh.__version__  
  • 如下图所示:

  • 现在让我们在 BokehApp 目录中创建一个模板文件夹并将其保存为模板。在模板目录中创建一个新文件并将其保存为 base.html。
  • base.html文件中的 head 标签中添加以下 CSS 链接,并在bokeh -xyz min(下划线位置 xyz)位置替换散景版本

HTML


  • 和结束 body 标签下方的 JavaScript 链接,即在 之后,并类似地替换你在 xyz 处的散景版本

HTML


  • base.html文件看起来像

HTML


Our first Bokeh Graph

      {{div| safe}}                        {{script| safe}}
  • 现在让我们替换视图函数home 以便它呈现我们的第一个图形。添加以下代码,在我们的绘图上创建基本的圆形散点标记:

Python

from django.shortcuts import render
from django.http import HttpResponse
from bokeh.plotting import figure
from bokeh.embed import components
 
# Create your views here.
 
def home(request):
 
   #create a plot
    plot = figure(plot_width=400, plot_height=400)
 
   # add a circle renderer with a size, color, and alpha
 
   plot.circle([1, 2, 3, 4, 5], [6, 7, 2, 4, 5], size=20, color="navy", alpha=0.5)
 
   script, div = components(plot)
 
   return render(request, 'base.html', {'script': script, 'div': div})
  • components方法返回一个包含绘图数据的脚本,并提供一个
    标签来显示绘图视图。这两个元素可以插入到 HTML 文本中,执行时                        {{script| safe}}

输出: