R 编程中的线性判别分析
最流行或最完善的机器学习技术之一是线性判别分析 (LDA)。它主要用于解决分类问题而不是监督分类问题。它基本上是一种降维技术。使用预测变量的线性组合,LDA 尝试预测给定观察的类别。让我们假设预测变量是 p。假设所有的类都具有相同的变量(即对于单变量分析,p 的值为 1)或相同的协方差矩阵(即对于多变量分析,p 的值大于 1)。
R中实现LDA的方法
可以使用包MASS的lda()函数在 R 中计算 LDA 或线性判别分析。 LDA 用于确定组均值,并且对于每个个体,它都尝试计算个体属于不同组的概率。因此,该特定个体在该组中获得最高概率分数。
要使用lda()函数,必须安装以下软件包:
-
lda()函数的MASS包。 - tidyverse包,用于更好、更轻松的数据操作和可视化。
- caret包,用于更好的机器学习工作流程。
在安装这些软件包时,然后准备数据。要准备数据,首先需要将数据拆分为训练集和测试集。然后需要对数据进行规范化。这样做时,会自动删除分类变量。一旦设置和准备好数据,就可以使用lda()函数从线性判别分析开始。
首先,LDA 算法试图找到可以最大化类之间分离的方向。然后它使用这些方向来预测每个人的类别。这些方向称为线性判别式,是预测变量的线性组合。
函数lda()的解释
在实施线性判别分析之前,让我们讨论要考虑的事项:
- 需要检查每个变量的单变量分布。它必须是正态分布的。如果不是,则使用指数分布的对数和根函数或偏态分布的 Box-Cox 方法进行变换。
- 需要去除数据的异常值,然后对变量进行标准化,以使规模具有可比性。
- 让我们假设因变量,即 Y 是离散的。
- LDA 假设预测变量是正态分布的,即它们来自高斯分布。各种类别具有类别特定的均值和相等的协方差或方差。
在MASS包下,我们有用于计算线性判别分析的lda()函数。让我们看看使用lda()函数的默认方法。
Syntax:
lda(formula, data, …, subset, na.action)
Or,
lda(x, grouping, prior = proportions, tol = 1.0e-4, method, CV = FALSE, nu, …)
Parameters:
formula: a formula which is of the form group ~ x1+x2..
data: data frame from which we want to take the variables or individuals of the formula preferably
subset: an index used to specify the cases that are to be used for training the samples.
na.action: a function to specify that the action that are to be taken if NA is found.
x: a matrix or a data frame required if no formula is passed in the arguments.
grouping: a factor that is used to specify the classes of the observations.prior: the prior probabilities of the class membership.
tol: a tolerance that is used to decide whether the matrix is singular or not.
method: what kind of methods to be used in various cases.
CV: if it is true then it will return the results for leave-one-out cross validation.
nu: the degrees of freedom for the method when it is method=”t”.
…: the various arguments passed from or to other methods.
函数lda()的输出中有以下元素:
- 组的先验可能性,即在每个组中训练观察的比例。
- 组是指组的重心,用于在组中显示每个变量的平均值。
- 线性判别系数,即用于形成LDA决策规则的预测变量的线性组合。
例子:
让我们看看如何使用lda()函数计算线性判别分析。让我们使用 R Studio 的 iris 数据集。
# LINEAR DISCREMINANT ANALYSIS

library(MASS)
library(tidyverse)
library(caret)
theme_set(theme_classic())

# Load the data
data("iris")

# Split the data into training (80%) and test set (20%)
set.seed(123)
training.individuals <- iris$Species %>%
            createDataPartition(p = 0.8, list = FALSE)
train.data <- iris[training.individuals, ]
test.data <- iris[-training.individuals, ]

# Estimate preprocessing parameters
preproc.parameter <- train.data %>%
  preProcess(method = c("center", "scale"))

# Transform the data using the estimated parameters
train.transform <- preproc.parameter %>% predict(train.data)
test.transform <- preproc.parameter %>% predict(test.data)

# Fit the model
model <- lda(Species~., data = train.transform)

# Make predictions
predictions <- model %>% predict(test.transform)

# Model accuracy
mean(predictions$class==test.transform$Species)

model <- lda(Species~., data = train.transform)
model
输出:
[1] 1
Call: lda(Species ~ ., data = train.transformed)

Prior probabilities of groups:
    setosa versicolor  virginica
 0.3333333  0.3333333  0.3333333

Group means:
           Sepal.Length Sepal.Width Petal.Length Petal.Width
setosa       -1.0120728   0.7867793   -1.2927218  -1.2496079
versicolor    0.1174121  -0.6478157    0.2724253   0.1541511
virginica     0.8946607  -0.1389636    1.0202965   1.0954568

Coefficients of linear discriminants:
                    LD1         LD2
Sepal.Length  0.9108023  0.03183011
Sepal.Width   0.6477657  0.89852536
Petal.Length -4.0816032 -2.22724052
Petal.Width  -2.3128276  2.65441936

Proportion of trace:
   LD1    LD2
0.9905 0.0095
输出的图形绘制
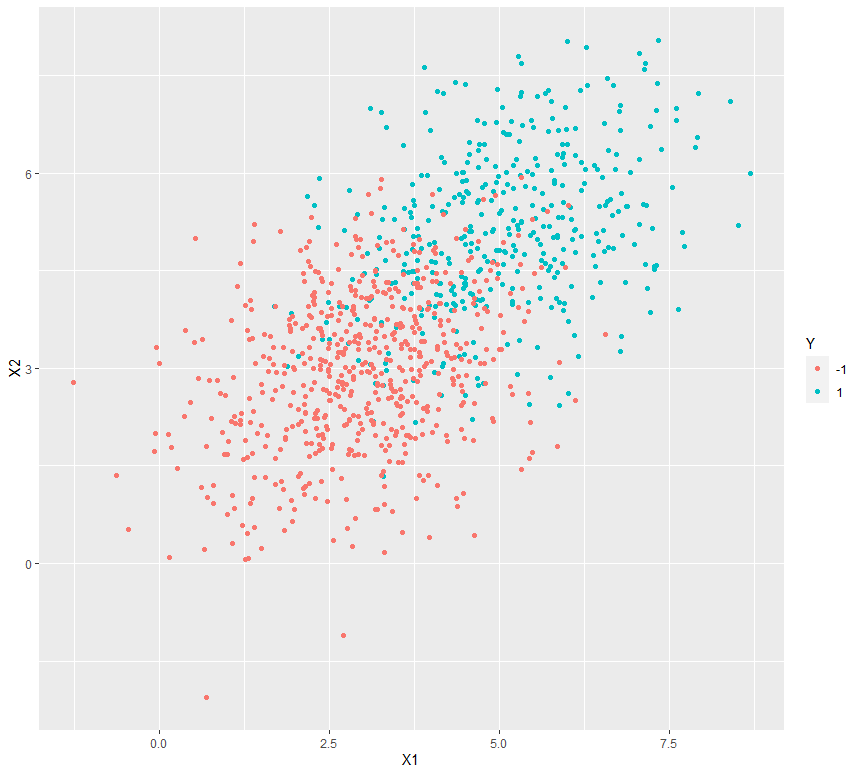
让我们看看在两个虚拟数据集上做了什么样的绘图。为此,让我们使用ggplot2包中的ggplot()函数来绘制从lda()获得的结果或输出。
例子:
# Graphical plotting of the output

library(ggplot2)
library(MASS)
library(mvtnorm)

# Variance Covariance matrix for random bivariate gaussian sample
var_covar = matrix(data = c(1.5, 0.4, 0.4, 1.5), nrow = 2)

# Random bivariate Gaussian samples for class +1
Xplus1 <- rmvnorm(400, mean = c(5, 5), sigma = var_covar)

# Random bivariate Gaussian samples for class -1
Xminus1 <- rmvnorm(600, mean = c(3, 3), sigma = var_covar)

# Samples for the dependent variable
Y_samples <- c(rep(1, 400), rep(-1, 600))

# Combining the independent and dependent variables into a dataframe
dataset <- as.data.frame(cbind(rbind(Xplus1, Xminus1), Y_samples))
colnames(dataset) <- c("X1", "X2", "Y")
dataset$Y <- as.character(dataset$Y)

# Plot the above samples and color by class labels
ggplot(data = dataset) + geom_point(aes(X1, X2, color = Y))
输出:

应用
- 在人脸识别系统中,LDA 用于在分类之前生成数量更少且更易于管理的特征。
- 在客户识别系统中,LDA 有助于识别和选择特征,这些特征可用于描述可以从购物中心购买特定商品或产品的一组客户的特征或特征。
- 在医学领域,LDA有助于识别各种疾病的特征,并根据患者的症状将其分类为轻度、中度或重度。