在 plotly 中使用 graph_objects 类的 Sunburst Plot
Plotly 是一个Python库,用于设计图形,尤其是交互式图形。它可以绘制各种图形和图表,如直方图、条形图、箱线图、散布图等等。它主要用于数据分析和财务分析。 plotly 是一个交互式可视化库。
使用 graph_objects 类的森伯斯特图
如果 Plotly Express 没有呈现一个好的起点,也可以从更通用的 go.sunburst 类中访问它。来自 plotly.graph_objects 的 Sunburst 是展示层次结构数据的原型。层次结构的每个级别都由一个环表示或以最里面的圆圈作为层次结构顶部的圆圈。没有任何层次结构数据的太阳图看起来类似于圆环图。
Syntax: class plotly.graph_objects.Sunburst(arg=None, branchvalues=None, count=None, customdata=None, hoverinfo=None, **kwargs)
Parameters:
arg: dict of properties compatible with this constructor or an instance of plotly.graph_objects.Sunburst
branchvalues: Determines how the items in values are summed.
count: Determines default for values when it is not provided, by inferring a 1 for each of the “leaves” and/or “branches”, otherwise 0.
customdata: Assigns extra data each datum. This may be useful when listening to hover, click and selection events. Note that, “scatter” traces also appends customdata items in the markers DOM elements
hoverinfo: Determines which trace information appear on hover. If none or skip are set, no information is displayed upon hovering. But, if none is set, click and hover events are still fired.
例子:
Python3
import plotly.graph_objects as go

fig = go.Figure(go.Sunburst(
    labels =["A", "B", "C", "D", "E", "F", "G", "H", "I"],
    parents =["", "A", "A", "C", "C", "A", "A", "G", "A" ],
    values =[11, 24, 2, 6, 7, 1, 1, 5, 4],
))

fig.update_layout(margin = dict(t = 0, l = 0, r = 0, b = 0))


fig.show()
Python3
import plotly.graph_objects as go

fig = go.Figure(go.Sunburst(
    labels =["A", "B", "C", "D", "E", "F", "G", "H", "I"],
    parents =["", "A", "A", "C", "C", "A", "A", "G", "A" ],
    values =[11, 24, 2, 6, 7, 1, 1, 5, 4],
    branchvalues ="remainder",
))

fig.update_layout(margin = dict(t = 0, l = 0, r = 0, b = 0))

fig.show()
Python3
import plotly.graph_objects as go
import pandas as pd

df = pd.read_csv('https://raw.githubusercontent.com / plotly / datasets / 718417069ead87650b90472464c7565dc8c2cb1c / sunburst-coffee-flavors-complete.csv')

fig = go.Figure()

fig.add_trace(go.Sunburst(
    ids = df.ids,
    labels = df.labels,
    parents = df.parents,
    domain = dict(column = 0)
))

fig.show()
输出:

显示分支值
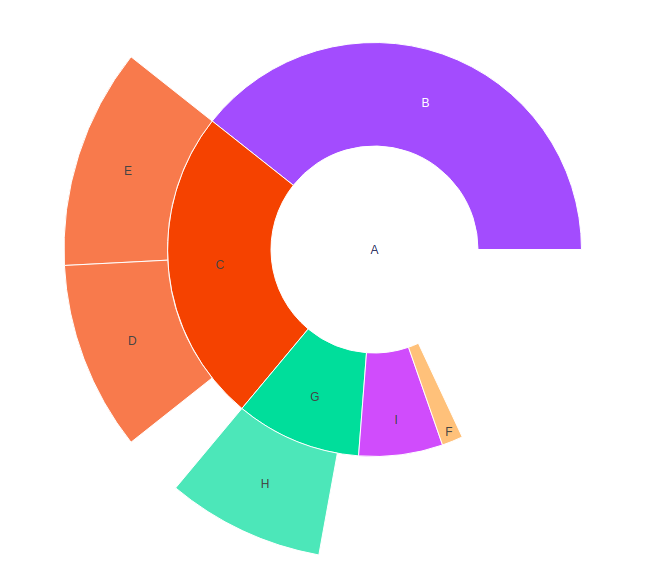
使用分支值“total”,父值表示楔形的宽度。使用branchvalues“remainder”,父宽度由自己的值加上children的值来划分。当branch值设置为“total”时,children的总和不能超过parent的总和。让我们看一个例子要了解更多信息,如下所示:
例子:
Python3
import plotly.graph_objects as go

fig = go.Figure(go.Sunburst(
    labels =["A", "B", "C", "D", "E", "F", "G", "H", "I"],
    parents =["", "A", "A", "C", "C", "A", "A", "G", "A" ],
    values =[11, 24, 2, 6, 7, 1, 1, 5, 4],
    branchvalues ="remainder",
))

fig.update_layout(margin = dict(t = 0, l = 0, r = 0, b = 0))

fig.show()
输出:

呈现大量切片
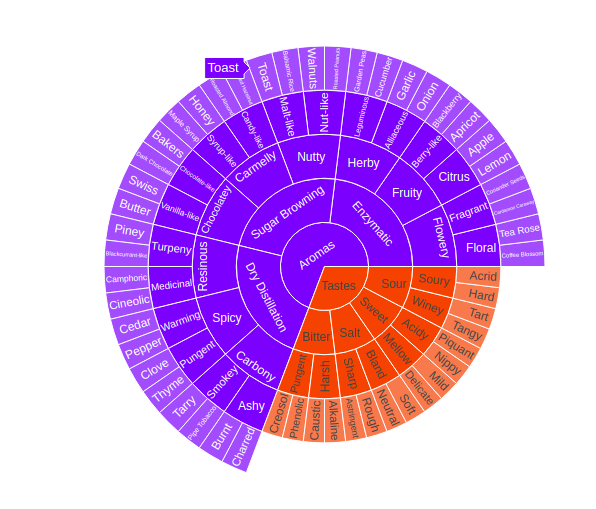
在 plotly 中,sunbrrust 图表在其饼图中有几个切片,这有助于以更易于理解和有效的方式呈现数据,因为每列数据通过不同的颜色分隔。各种数据切片可以构建在一个饼图中,从而导致在布局中占用更少的空间。让我们看一个下面给出的示例
例子:
Python3
import plotly.graph_objects as go
import pandas as pd

df = pd.read_csv('https://raw.githubusercontent.com / plotly / datasets / 718417069ead87650b90472464c7565dc8c2cb1c / sunburst-coffee-flavors-complete.csv')

fig = go.Figure()

fig.add_trace(go.Sunburst(
    ids = df.ids,
    labels = df.labels,
    parents = df.parents,
    domain = dict(column = 0)
))

fig.show()
输出:
