Julia 中的描述性统计
Julia 是一种适合执行数据分析的编程语言。它有各种内置的统计函数和包来支持描述性统计。描述性统计有助于理解给定数据的特征并快速总结。
在 Julia 中执行描述性统计所需的包:
- Distributions.jl:它提供了大量的概率分布和相关函数,例如采样、矩、熵、概率密度、对数、最大似然估计、分布组合等。
- StatsBase.jl:它提供对统计的基本支持。它由各种与统计相关的函数组成,如标量统计、高阶矩计算、计数、排序、协方差、采样和经验密度估计。
- CSV.jl:用于读取和写入逗号分隔值 (CSV) 文件。
- Dataframes.jl:用于创建不同的数据结构。
- StatsPlots.jl:用于表示各种统计图。
在 Julia 中执行描述性统计的步骤:
步骤 1:安装所需的软件包
以下命令可用于安装所需的软件包:
Using Pkg
Pkg.add(“Distributions”)
Pkg.add(“StatsBase”)
Pkg.add(“CSV”)
Pkg.add(“Dataframes”)
Pkg.add(“StatsPlots”)
步骤 2:导入所需的包
Julia
# Descriptive Statistics in Julia
# Importing required packages
# to perform descriptive statistics

# For random variable creation
using Distributions

# For basic statistical operations
using StatsBase

# For reading and writing CSV files
using CSV

# For creation of Data Structures
using DataFrames

# For representing various plots
using StatsPlots

# Uniform Distribution
Age = rand(10:95, 100);

# Weighted Uniform Distribution
BloodGrp = rand(["A", "B", "O", "AB"], 100);

# mean of Age variable
mean(Age)

# median of Age variable
median(Age)

# Variance of Age variable
var(Age)

# Standard deviation of Age variable
std(Age)

# Descriptive statistics of Age variable
describe(Age)

# summarystats function excludes type
summarystats(Age)
Julia
# Descriptive Statistics in Julia
# Importing required packages
# to perform descriptive statistics

# For random variable creation
using Distributions

# For basic statistical operations
using StatsBase

# For reading and writing CSV files
using CSV

# For creation of Data Structures
using DataFrames

# For representing various plots
using StatsPlots

# Uniform Distribution
Age = rand(10:95, 100);

# Weighted Uniform Distribution
BloodGrp = rand(["A", "B", "O", "AB"], 100);

# Creation of data frame
DF = DataFrame(AGE = Age, BGRP = BloodGrp);

# number of rows and columns
size(DF)

# First 5 rows
head(DF, 5)

# Last 5 rows
tail(DF, 5)

# Selecting specific data only
# Data in which BGRP=AB is printed
DFAB = DF[DF[:BGRP] .=="AB", :]

# Data in which AGE>50 is printed
DF50 = DF[DF[:AGE] .>90, :]
Julia
# Descriptive Statistics in Julia
# Importing required packages
# to perform descriptive statistics

# For random variable creation
using Distributions

# For basic statistical operations
using StatsBase

# For reading and writing CSV files
using CSV

# For creation of Data Structures
using DataFrames

# For representing various plots
using StatsPlots

# Uniform Distribution
Age = rand(10:95, 100);

# Weighted Uniform Distribution
BloodGrp = rand(["A", "B", "O", "AB"], 100);

# Creation of data frame
DF = DataFrame(AGE = Age, BGRP = BloodGrp);

# Perform descriptive statistics of data frame
describe(DF)
Julia
# Descriptive Statistics in Julia
# Importing required packages
#to perform descriptive statistics

# For random variable creation
using Distributions

# For basic statistical operations
using StatsBase

# For reading and writing CSV files
using CSV

# For creation of Data Structures
using DataFrames

# For representing various plots
using StatsPlots

# Uniform Distribution
Age = rand(10:95, 100);

# Weighted Uniform Distribution
BloodGrp = rand(["A", "B", "O", "AB"], 100);

# Creation of data frame
DF = DataFrame(AGE = Age, BGRP = BloodGrp);

# Counting the number of rows
# with blood groups A,B,O,AB
by(DF, :BGRP, DF-> DataFrame(Total = size(DF, 1)))

# Counting the number of rows
# with blood groups A, B, O, AB
# using size argument
by(DF, :BGRP, size)
Julia
# Descriptive Statistics in Julia
# Importing required packages
# to perform descriptive statistics

# For random variable creation
using Distributions

# For basic statistical operations
using StatsBase

# For reading and writing CSV files
using CSV

# For creation of Data Structures
using DataFrames

# For representing various plots
using StatsPlots

# Uniform Distribution
Age = rand(10:95, 100);

# Weighted Uniform Distribution
BloodGrp = rand(["A", "B", "O", "AB"], 100);

# Creation of data frame
DF = DataFrame(AGE = Age, BGRP = BloodGrp);

# Mean AGE of Blood groups A, B, AB, O
by(DF, :BGRP, DF->mean(DF.AGE))

# Using the describe function
# we can get the complete descriptive statistics
by(DF, :BGRP, DF->describe(DF.AGE))
Julia
# Descriptive Statistics in Julia
# Importing required packages
# to perform descriptive statistics

# For random variable creation
using Distributions

# For basic statistical operations
using StatsBase

# For reading and writing CSV files
using CSV

# For creation of Data Structures
using DataFrames

# For representing various plots
using StatsPlots

# Uniform Distribution
Age = rand(10:95, 100);

# Weighted Uniform Distribution
BloodGrp = rand(["A", "B", "O", "AB"], 100);

# Creation of data frame
DF = DataFrame(AGE = Age, BGRP = BloodGrp);

# Plotting density plot
@df DF density(
   :AGE,
   group = :BGRP,
   xlab = "Age",
   ylab = "Distribution"
)
Julia
# Descriptive Statistics in Julia
# Importing required packages to perform descriptive statistics

# For random variable creation
using Distributions

# For basic statistical operations
using StatsBase

# For reading and writing CSV files
using CSV

# For creation of Data Structures
using DataFrames

# For representing various plots
using StatsPlots

# Uniform Distribution
Age = rand(10:95, 100);

# Weighted Uniform Distribution
BloodGrp = rand(["A", "B", "O", "AB"], 100);

# Creation of data frame
DF = DataFrame(AGE = Age, BGRP = BloodGrp);

# Plotting Box plot
@df DF boxplot(
  :AGE,
  xlab = ”Age”,
  ylab = ”Distribution”
)
第 3 步:创建受激数据(随机变量)
让我们用随机数据值创建各种变量
例子:
朱莉娅
# Descriptive Statistics in Julia
# Importing required packages
# to perform descriptive statistics

# For random variable creation
using Distributions

# For basic statistical operations
using StatsBase

# For reading and writing CSV files
using CSV

# For creation of Data Structures
using DataFrames

# For representing various plots
using StatsPlots

# Uniform Distribution
Age = rand(10:95, 100);

# Weighted Uniform Distribution
BloodGrp = rand(["A", "B", "O", "AB"], 100);
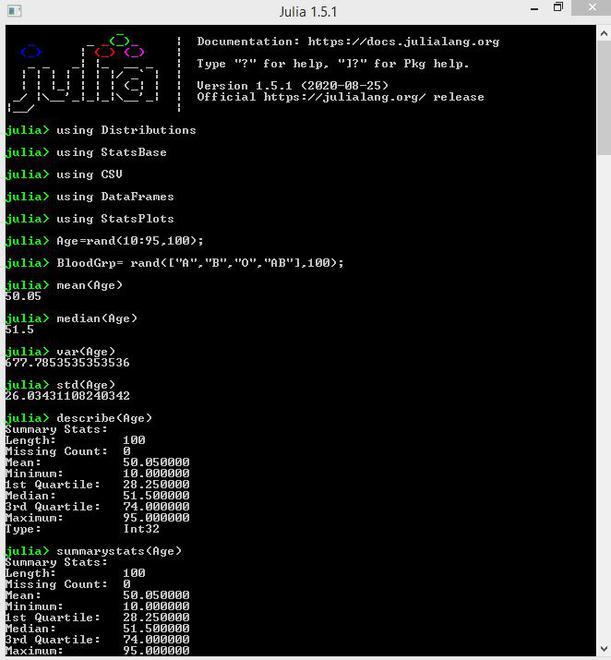
第 4 步:执行描述性统计
Julia 中常见的统计函数包括mean() 、 median() 、 var()和std() ,分别用于计算数据的均值、中值、方差和标准差。更方便的函数是 StatsBase 包中的 describe () 、 summarystats()来执行描述性统计。
例子:
朱莉娅
# Descriptive Statistics in Julia
# Importing required packages
# to perform descriptive statistics

# For random variable creation
using Distributions

# For basic statistical operations
using StatsBase

# For reading and writing CSV files
using CSV

# For creation of Data Structures
using DataFrames

# For representing various plots
using StatsPlots

# Uniform Distribution
Age = rand(10:95, 100);

# Weighted Uniform Distribution
BloodGrp = rand(["A", "B", "O", "AB"], 100);

# mean of Age variable
mean(Age)

# median of Age variable
median(Age)

# Variance of Age variable
var(Age)

# Standard deviation of Age variable
std(Age)

# Descriptive statistics of Age variable
describe(Age)

# summarystats function excludes type
summarystats(Age)
输出:
第 5 步:从受激数据创建数据框
受激数据应存储在数据框对象中,以便轻松执行操作操作。
例子:
朱莉娅
# Descriptive Statistics in Julia
# Importing required packages
# to perform descriptive statistics
# For random variable creation
using Distributions
# For basic statistical operations
using StatsBase
# For reading and writing CSV files
using CSV
# For creation of Data Structures
using DataFrames
# For representing various plots
using StatsPlots
# Uniform Distribution
Age = rand(10:95, 100);
# Weighted Uniform Distribution
BloodGrp = rand(["A", "B", "O", "AB"], 100);
# Creation of data frame
DF = DataFrame(AGE = Age, BGRP = BloodGrp);
# number of rows and columns
size(DF)
# First 5 rows
head(DF, 5)
# Last 5 rows
tail(DF, 5)
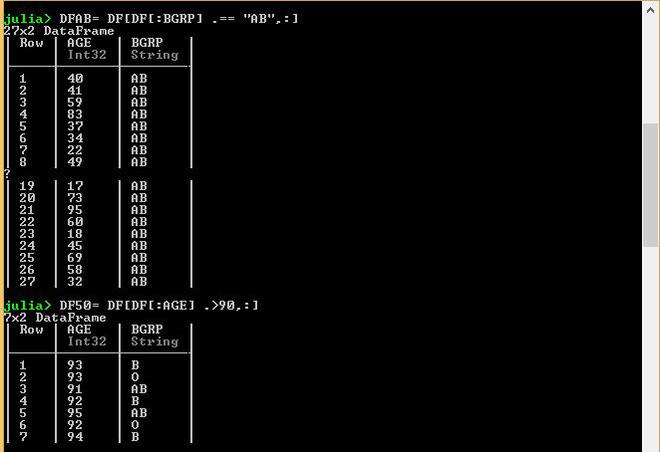
# Selecting specific data only
# Data in which BGRP=AB is printed
DFAB = DF[DF[:BGRP] .=="AB", :]
# Data in which AGE>50 is printed
DF50 = DF[DF[:AGE] .>90, :]
输出:

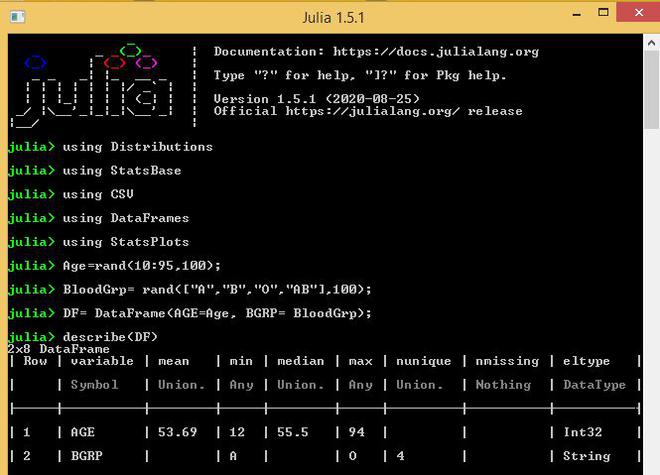
第 6 步:使用 DataFrame 对象进行描述性统计
- describe()函数可用于执行数据对象的描述性统计。
例子:
朱莉娅
# Descriptive Statistics in Julia
# Importing required packages
# to perform descriptive statistics

# For random variable creation
using Distributions

# For basic statistical operations
using StatsBase

# For reading and writing CSV files
using CSV

# For creation of Data Structures
using DataFrames

# For representing various plots
using StatsPlots

# Uniform Distribution
Age = rand(10:95, 100);

# Weighted Uniform Distribution
BloodGrp = rand(["A", "B", "O", "AB"], 100);

# Creation of data frame
DF = DataFrame(AGE = Age, BGRP = BloodGrp);

# Perform descriptive statistics of data frame
describe(DF)
输出:
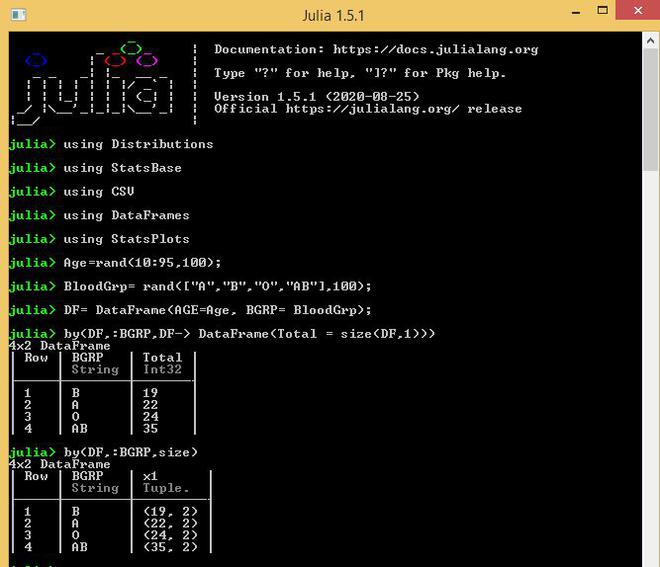
- by()函数用于计算分类变量的样本空间中的元素数量。
例子:
朱莉娅
# Descriptive Statistics in Julia
# Importing required packages
#to perform descriptive statistics

# For random variable creation
using Distributions

# For basic statistical operations
using StatsBase

# For reading and writing CSV files
using CSV

# For creation of Data Structures
using DataFrames

# For representing various plots
using StatsPlots

# Uniform Distribution
Age = rand(10:95, 100);

# Weighted Uniform Distribution
BloodGrp = rand(["A", "B", "O", "AB"], 100);

# Creation of data frame
DF = DataFrame(AGE = Age, BGRP = BloodGrp);

# Counting the number of rows
# with blood groups A,B,O,AB
by(DF, :BGRP, DF-> DataFrame(Total = size(DF, 1)))

# Counting the number of rows
# with blood groups A, B, O, AB
# using size argument
by(DF, :BGRP, size)
输出:
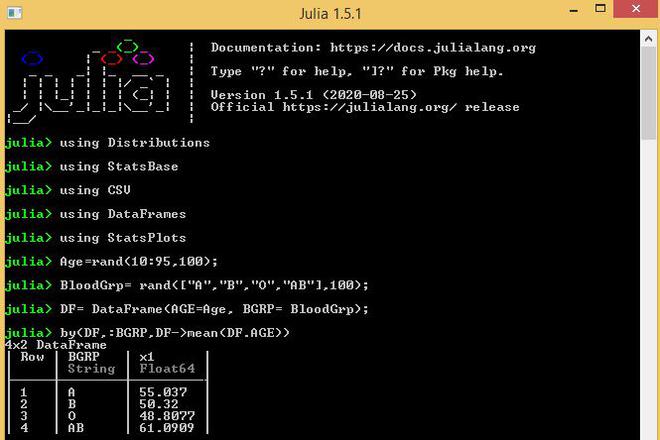
- 不同数值变量的描述性统计量可以通过分类变量分离后计算。
例子:
朱莉娅
# Descriptive Statistics in Julia
# Importing required packages
# to perform descriptive statistics

# For random variable creation
using Distributions

# For basic statistical operations
using StatsBase

# For reading and writing CSV files
using CSV

# For creation of Data Structures
using DataFrames

# For representing various plots
using StatsPlots

# Uniform Distribution
Age = rand(10:95, 100);

# Weighted Uniform Distribution
BloodGrp = rand(["A", "B", "O", "AB"], 100);

# Creation of data frame
DF = DataFrame(AGE = Age, BGRP = BloodGrp);

# Mean AGE of Blood groups A, B, AB, O
by(DF, :BGRP, DF->mean(DF.AGE))

# Using the describe function
# we can get the complete descriptive statistics
by(DF, :BGRP, DF->describe(DF.AGE))
输出:

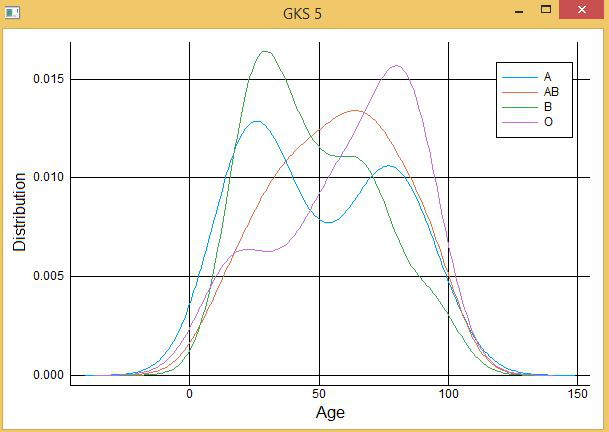
第 7 步:使用绘图可视化数据
DataFrames 包与使用宏函数的 Plots 包配合良好。在以下代码中:
- 让我们分析血型 A、B、AB、O 的年龄分布:
例子:
朱莉娅
# Descriptive Statistics in Julia
# Importing required packages
# to perform descriptive statistics

# For random variable creation
using Distributions

# For basic statistical operations
using StatsBase

# For reading and writing CSV files
using CSV

# For creation of Data Structures
using DataFrames

# For representing various plots
using StatsPlots

# Uniform Distribution
Age = rand(10:95, 100);

# Weighted Uniform Distribution
BloodGrp = rand(["A", "B", "O", "AB"], 100);

# Creation of data frame
DF = DataFrame(AGE = Age, BGRP = BloodGrp);

# Plotting density plot
@df DF density(
   :AGE,
   group = :BGRP,
   xlab = "Age",
   ylab = "Distribution"
)
输出:
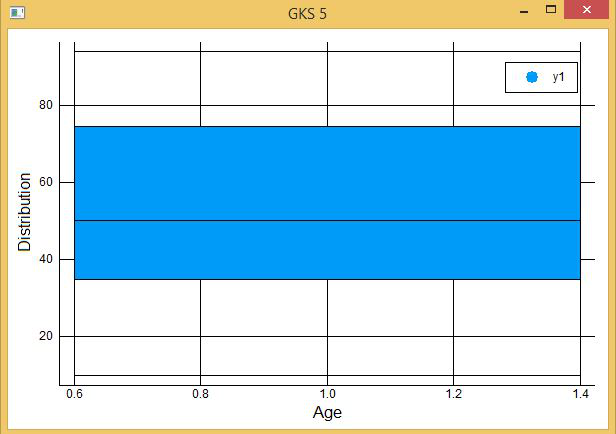
- 让我们创建一个 Age 的盒须图:
例子:
朱莉娅
# Descriptive Statistics in Julia
# Importing required packages to perform descriptive statistics

# For random variable creation
using Distributions

# For basic statistical operations
using StatsBase

# For reading and writing CSV files
using CSV

# For creation of Data Structures
using DataFrames

# For representing various plots
using StatsPlots

# Uniform Distribution
Age = rand(10:95, 100);

# Weighted Uniform Distribution
BloodGrp = rand(["A", "B", "O", "AB"], 100);

# Creation of data frame
DF = DataFrame(AGE = Age, BGRP = BloodGrp);

# Plotting Box plot
@df DF boxplot(
  :AGE,
  xlab = ”Age”,
  ylab = ”Distribution”
)
输出: