R 中的卡方分布
具有 df 自由度的卡方分布是在 df 独立标准正态随机变量的平方和上计算的分布。该分布用于数据的分类分析。
让我们将 X 1 , X 2 ,..., X m视为具有标准正态分布的 m 个独立随机变量,那么遵循具有 m 个自由度的卡方分布的数量可以评估如下。该分布的均值为m,其方差分别相当于2*m。
公式:
qchisq()函数
qchisq 给出分位数函数。当我们提供 ncp = 0 的值时,将使用非中心分布的算法。此方法的值等效于第 q 个百分位数处的 x 值(lower.tail = TRUE)。
Syntax:
qchisq(p, df, ncp = 0, lower.tail = TRUE, log.p = FALSE)
Parameter :
- p – vector of probabilities
- df – degrees of freedom
- ncp – non-centrality parameter (non-negative).
- log.p – logical; if TRUE, probabilities p are given as log(p).
- lower.tail – logical; if TRUE (default), probabilities are P[X ≤ x], otherwise, P[X > x].
例子:
R
# defining the degrees of freedom
free = 5
qchisq(.75, df=free)
R
# defining the degrees of freedom
free = 5
qchisq(.999, df=free, lower.tail = TRUE)
R
# defining degrees of freedom
df = 6
vec <- 1:4

print ("Density function values")

dchisq(vec, df = df)
R
# defining degrees of freedom
df = 5

# calculating for the values in the interval [0,5]
print ("Calculating for the values [0,5]")
pchisq(5, df = df,lower.tail = TRUE)

# calculating for the values in the interval [5,inf)
print ("Calculating for the values [5,inf)")
pchisq(5, df = df,lower.tail = FALSE)
R
# computing values of 50k random values with 5 degrees of freedom
x <- rchisq(50000, df = 5)

hist(x,
     freq = FALSE,
     xlim = c(0,16),
     ylim = c(0,0.2))

curve(dchisq(x, df = 5), from = 0, to = 15,
      n = 5000, col= 'red', lwd=2, add = T)
输出
[1] 6.62568
此函数还可用于计算曲线下给定面积的分位数。
例子:
电阻
# defining the degrees of freedom
free = 5
qchisq(.999, df=free, lower.tail = TRUE)
输出
[1] 20.51501
dchisq()函数
dchisq 给出密度函数。即用于计算小于或等于分位数向量的值的累积概率(左尾为lower.tail = TRUE,右尾为lower.tail = FALSE),即q。
Syntax:
dchisq(x, df, ncp = 0, log = FALSE)
Parameter :
- x – vector of quantiles
- df – degrees of freedom
- ncp – non-centrality parameter (non-negative).
- log.p – logical; if TRUE, probabilities p are given as log(p).
例子:
电阻
# defining degrees of freedom
df = 6
vec <- 1:4

print ("Density function values")

dchisq(vec, df = df)
输出
[1] “Density function values”
[1] 0.03790817 0.09196986 0.12551072 0.13533528
pchisq()函数
pchisq 给出了分布函数。 dchisq(x, df) 给出了当自由度为 df 时 χ2 的概率等于 x 的值。此方法可用于计算具有给定自由度数的 χ2 曲线的指定区间的曲线下面积。
Syntax:
pchisq(q, df, ncp = 0, lower.tail = TRUE, log.p = FALSE)
Parameter :
- q – vector of quantiles
- df – degrees of freedom
- ncp – non-centrality parameter (non-negative).
- log.p – logical; if TRUE, probabilities p are given as log(p).
- lower.tail – logical; if TRUE (default), probabilities are P[X ≤ x], otherwise, P[X > x].
例子:
电阻
# defining degrees of freedom
df = 5

# calculating for the values in the interval [0,5]
print ("Calculating for the values [0,5]")
pchisq(5, df = df,lower.tail = TRUE)

# calculating for the values in the interval [5,inf)
print ("Calculating for the values [5,inf)")
pchisq(5, df = df,lower.tail = FALSE)
输出
[1] “Calculating for the values [0,5]”
[1] 0.5841198
[1] “Calculating for the values [5,inf)”
[1] 0.4158802
区间 [0,5] 和 [5,∞) 下曲线的总和等于 1。
rchisq()函数
rchisq(n, df) 从卡方分布中返回 n 个随机数。因此产生随机偏差。
Syntax:
rchisq(n, df, ncp = 0)
Parameter :
- n – number of observations. If length(n) > 1, the length is taken to be the number required.
- df – degrees of freedom (non-negative, but can be non-integer).
- ncp – non-centrality parameter (non-negative).
例子:
电阻
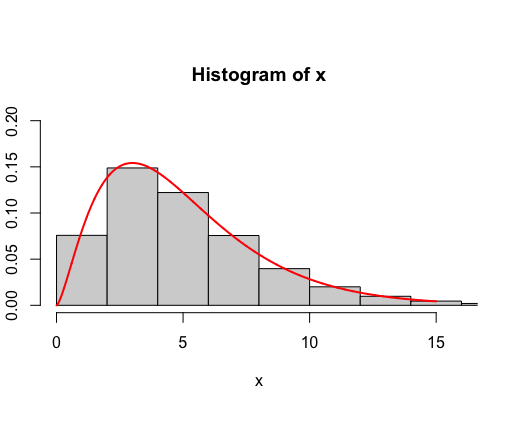
# computing values of 50k random values with 5 degrees of freedom
x <- rchisq(50000, df = 5)

hist(x,
     freq = FALSE,
     xlim = c(0,16),
     ylim = c(0,0.2))

curve(dchisq(x, df = 5), from = 0, to = 15,
      n = 5000, col= 'red', lwd=2, add = T)
输出