SciPy - 曲线拟合的微分方程的积分
在机器学习中,我们所做的通常是收集数据,将其可视化,然后在图中拟合曲线,然后根据曲线拟合预测某些参数。如果我们有一些理论数据,我们可以使用验证数据集中的曲线拟合来提取方程并进行验证。因此,要找到任何阶曲线的方程,无论是线性的、二次的还是多项式的,我们使用微分方程,然后对该方程进行积分,我们就可以得到曲线拟合。
在Python SciPy中,通过使用odeint() 对微分方程进行数学积分,可以轻松完成此过程以求解微分方程。 odeint(model, y0, t)可用于通过采用三个或更多参数来求解任何阶微分方程。
Parameters :
model– the differential equation
y0– Initial value of Y
t– the time space for which we want the curve(basically the range of x)
让我们用一个例子来说明这一点:

代码:求解方程得到 y = x – 1 + 2 (e^-x) 作为解
python3
import numpy as np
from scipy.integrate import odeint
import matplotlib.pyplot as plt

from scipy.integrate import odeint

# Define a function which calculates the derivative by making dy/dx as
# the subject of formula in the given above equation
def dy_dx(y, x):
    return x - y

#Here we define the graph limits for x
xs = np.linspace(-5,5,100)

#Initially y=1 given
y0 = 1.0

# This scipy.integrate.odeint() integrates the given equation by taking
# 3 parameters odeint(model,y0,t)
# model- the differential equation function
# y0-the initial value of y
# t- the timepoints for which we need to plot the curve
ys = odeint(dy_dx, y0, xs)
ys = np.array(ys).flatten()

# By using the matplotlib.pyplot library we plot the curve after integration
plt.rcParams.update({'font.size': 14})  # increase the font size
plt.xlabel("x-values")
plt.ylabel("Y- values")
plt.title('Curve of -> y=x-1+2*(e^-x)')
plt.plot(xs, ys,color='green')
输出:
这是使用 scipy.integrate.odeint( ) 生成的图表,可以在下面看到并进一步用于曲线拟合——用于分析机器学习中的数据。
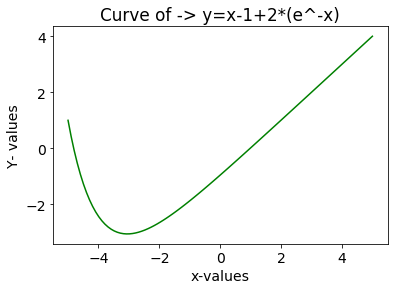
积分微分方程后生成的图形