Python中的 Matplotlib.colors.LogNorm 类
Matplotlib是Python中用于数组二维图的惊人可视化库。 Matplotlib 是一个基于 NumPy 数组构建的多平台数据可视化库,旨在与更广泛的 SciPy 堆栈配合使用。
matplotlib.colors.LogNorm()
matplotlib.colors.LogNorm()类属于matplotlib.colors模块。 matplotlib.colors 模块用于将颜色或数字参数转换为 RGBA 或 RGB。此模块用于将数字映射到颜色或在一维颜色数组(也称为颜色图)中进行颜色规范转换。
matplotlib.colors.LogNorm 类用于将值标准化为对数刻度上的 0-1 范围。如果未设置 vmax 或 vmin,则它们分别从处理的第一个输入的最大值和最小值初始化。这意味着__call__(A)调用 autoscale_None(A)。如果剪辑设置为 True 并且给定的值超出范围,则返回的值为 0 或 1,以最接近的为准。如果 vmin==vmax 则返回 0。它适用于还包括掩码数组的数组或标量。如果剪辑设置为 True,则将掩码值设置为,否则它们将保持掩码。剪辑的默认设置为 False。
类的方法:
- autoscale(self, A):用于将 vmax、vmin 分别设置为 A 的最大值和最小值。
- autoscale_None(self, A):仅用于自动缩放无值的 vmin 或 vmax。
- inverse(self, value) :它返回颜色图的反转值。
示例 1:
import matplotlib.pyplot as plt
import numpy as np
from matplotlib import colors
from matplotlib.ticker import PercentFormatter
# Setting random state for
# reproducibility
np.random.seed(19680801)
max_points = 100000
all_bins = 20
# Generate a normal distribution,
# center at x = 0 and y = 5
a = np.random.randn(max_points)
b = .4 * a + np.random.randn(100000) + 5
figure, axes = plt.subplots(3, 1,
figsize =(5, 15),
sharex = True,
sharey = True,
tight_layout = True)
# Incrementing the number of
# bins on each axis
axes[0].hist2d(a, b, bins = 40)
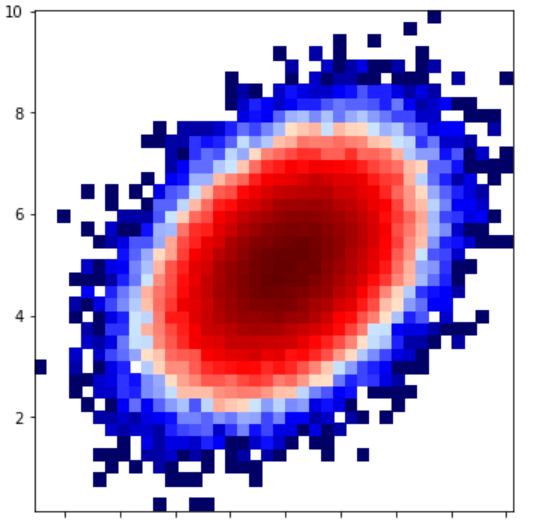
# Defining normalization of
# the colors
axes[1].hist2d(a, b, bins = 40,
norm = colors.LogNorm())
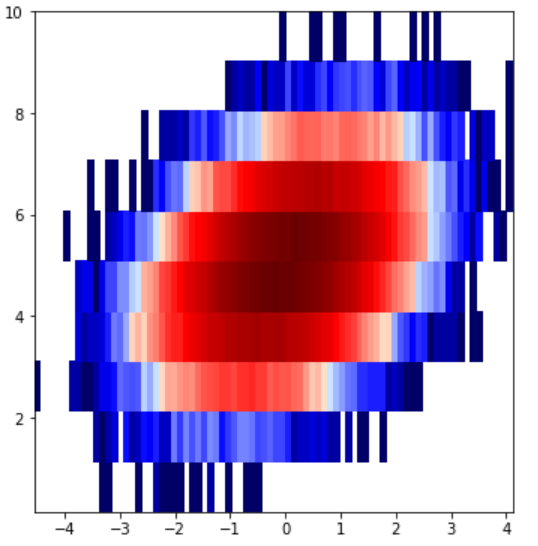
# defining custom numbers of bins
# for each axis
axes[2].hist2d(a, b, bins =(80, 10),
norm = colors.LogNorm())
plt.show()
输出: 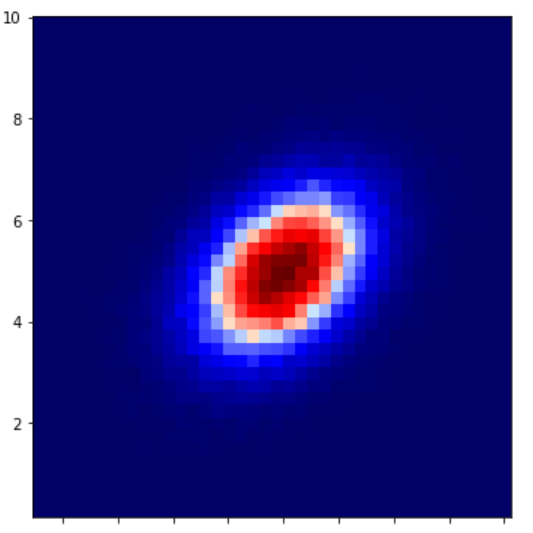
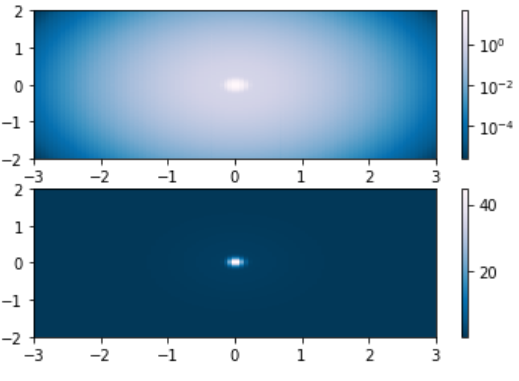
示例 2:
import matplotlib.pyplot as plt
import numpy as np
from matplotlib.colors import LogNorm


N = 100
A, B = np.mgrid[-3:3:complex(0, N),
                -2:2:complex(0, N)]

X1 = np.exp(-(A)**2 - (B)**2)
X2 = np.exp(-(A * 10)**2 - (B * 10)**2)
X = X1 + 50 * X2

figure, (axes0, axes1) = plt.subplots(2, 1)

P = axes0.pcolor(A, B, X,
               norm = LogNorm(vmin = X.min(),
                              vmax = X.max()),
                 cmap ='PuBu_r')

figure.colorbar(P, ax = axes0)

P = axes1.pcolor(A, B, X,
                 cmap ='PuBu_r')

figure.colorbar(P, ax = axes1)

plt.show()
输出: