Python中的 Matplotlib.colors.DivergingNorm 类
Matplotlib是Python中用于数组二维图的惊人可视化库。 Matplotlib 是一个基于 NumPy 数组构建的多平台数据可视化库,旨在与更广泛的 SciPy 堆栈配合使用。
matplotlib.colors.DivergingNorm
matplotlib.colors.DivergingNorm类属于matplotlib.colors模块。 matplotlib.colors 模块用于将颜色或数字参数转换为 RGBA 或 RGB。该模块用于将数字映射到颜色或在一维颜色数组(也称为颜色图)中进行颜色规范转换。
matplotlib.colors.DivergingNorm 类在映射概念中心周围变化率不均匀或不相等的数据时非常有用。例如数据范围在 -2 到之间,以 0 为中心或中点。
Syntax: matplotlib.colors.DivergingNorm(vcenter, vmin, vmax)
Parameters:
- vcenter: It accepts a float valuethat defines the 0.5 data value in the normalization.
- vmin: It is an optional parameter that accepts float values and defines 0.0 data value in normalization which defaults to the minimum value of dataset.
- vmax: It is an optional parameter that accepts float values and defines 1.0 data value in normalization which defaults to the maximum value of dataset.
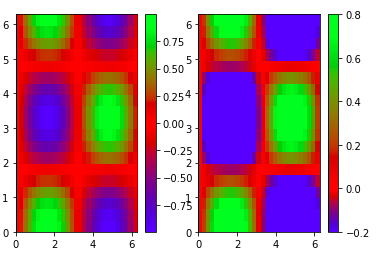
示例 1:
Python3
import numpy
from matplotlib import pyplot as plt
from matplotlib import colors


# dummy data to plot
x = numpy.linspace(0, 2*numpy.pi, 30)
y = numpy.linspace(0, 2*numpy.pi, 20)
[A, B] = numpy.meshgrid(x, y)
Q = numpy.sin(A)*numpy.cos(B)

fig = plt.figure()
plt.ion()

#  yellow to green to red
# colormap
plt.set_cmap('brg')

ax = fig.add_subplot(1, 2, 1)
plt.pcolor(A, B, Q)
plt.colorbar()

ax = fig.add_subplot(1, 2, 2)

# defining the scale, with white
# at zero
vmin = -0.2
vmax = 0.8
norms = colors.DivergingNorm(vmin=vmin,
                             vcenter=0,
                             vmax=vmax)

plt.pcolor(A, B, Q,
           vmin=vmin,
           vmax=vmax,
           norm=norms)

plt.colorbar()
Python3
import numpy as np
import matplotlib.pyplot as plt
import matplotlib.cbook as cbook
import matplotlib.colors as colors

file = cbook.get_sample_data('topobathy.npz',
                             asfileobj = False)

with np.load(file) as example:
    topo = example['topo']
    longi = example['longitude']
    latit = example['latitude']

figure, axes = plt.subplots(constrained_layout = True)

# creating a colormap that
# has land and ocean clearly
# delineated and of the
# same length (256 + 256)
undersea = plt.cm.terrain(np.linspace(0, 0.17, 256))
land = plt.cm.terrain(np.linspace(0.25, 1, 256))
every_colors = np.vstack((undersea, land))

terrain_map = colors.LinearSegmentedColormap.from_list('terrain_map',
                                                       every_colors)

# the center is offset so that
# the land has more dynamic range
# while making the norm
diversity_norm = colors.DivergingNorm(vmin =-500,
                                      vcenter = 0,
                                      vmax = 4000)

pcm = axes.pcolormesh(longi, latit, topo,
                      rasterized = True,
                      norm = diversity_norm,
                      cmap = terrain_map, )

axes.set_xlabel('Longitude $[^o E]$')
axes.set_ylabel('Latitude $[^o N]$')
axes.set_aspect(1 / np.cos(np.deg2rad(49)))

figure.colorbar(pcm, shrink = 0.6,
                extend ='both',
                label ='Elevation [m]')
plt.show()
输出:
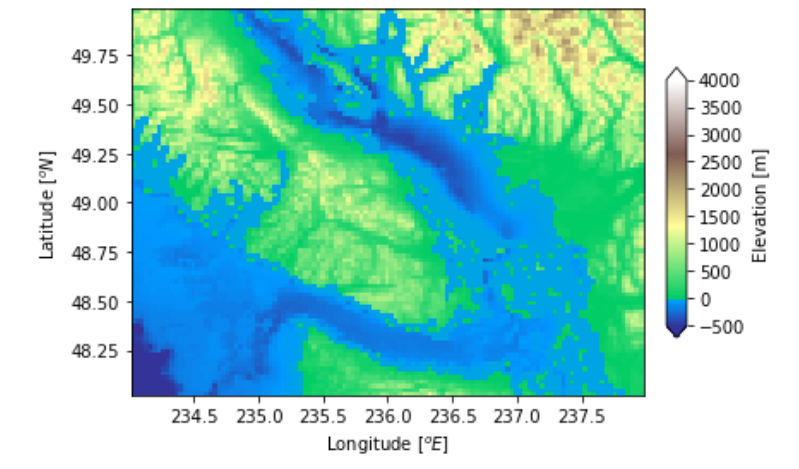
示例 2:
Python3
import numpy as np
import matplotlib.pyplot as plt
import matplotlib.cbook as cbook
import matplotlib.colors as colors

file = cbook.get_sample_data('topobathy.npz',
                             asfileobj = False)

with np.load(file) as example:
    topo = example['topo']
    longi = example['longitude']
    latit = example['latitude']

figure, axes = plt.subplots(constrained_layout = True)

# creating a colormap that
# has land and ocean clearly
# delineated and of the
# same length (256 + 256)
undersea = plt.cm.terrain(np.linspace(0, 0.17, 256))
land = plt.cm.terrain(np.linspace(0.25, 1, 256))
every_colors = np.vstack((undersea, land))

terrain_map = colors.LinearSegmentedColormap.from_list('terrain_map',
                                                       every_colors)

# the center is offset so that
# the land has more dynamic range
# while making the norm
diversity_norm = colors.DivergingNorm(vmin =-500,
                                      vcenter = 0,
                                      vmax = 4000)

pcm = axes.pcolormesh(longi, latit, topo,
                      rasterized = True,
                      norm = diversity_norm,
                      cmap = terrain_map, )

axes.set_xlabel('Longitude $[^o E]$')
axes.set_ylabel('Latitude $[^o N]$')
axes.set_aspect(1 / np.cos(np.deg2rad(49)))

figure.colorbar(pcm, shrink = 0.6,
                extend ='both',
                label ='Elevation [m]')
plt.show()
输出: