Python中的 Matplotlib.colors.ListedColormap 类
Matplotlib是Python中用于数组二维图的惊人可视化库。 Matplotlib 是一个基于 NumPy 数组的多平台数据可视化库,旨在与更广泛的 SciPy 堆栈一起使用。
Matplotlib.colors.ListedColormap
matplotlib.colors.ListedColormap类属于matplotlib.colors模块。 matplotlib.colors 模块用于将颜色或数字参数转换为 RGBA 或 RGB。此模块用于将数字映射到颜色或在一维颜色数组(也称为颜色图)中进行颜色规范转换。
matplotlib.colors.ListedColormap 类用于从颜色列表创建 colarmap 对象。这对于直接索引颜色图很有用,也可以用于为法线贴图创建特殊的颜色图。
Syntax: class matplotlib.colors.ListedColormap(colors, name=’from_list’, N=None)
Parameters:
- colors: It is an array or list of Matplotlib color specifications or equat to N x 3 or N x 4 floating point array(N rgb or rgba values)
- name: It is an optional parameter that accepts a string to identify the colormap.
- N: It is an optional parameter that accepts an integer value representing the number of entries in the map. Its default is None, where there is single colormap entry for every element in the list of colors. If N is less than len(colors) the list truncates at N whereas if N is greater than the list is extended with repetition.
类的方法:
1) reversed():用于创建颜色图的反转实例。
Syntax: reversed(self, name=None)
Parameters:
- name: It is an optional parameter that that represents the name for the reversed colormap. If it’s set to None the name will be the name of the parent colormap + “_r”.
Returns: It returns a reversed instance of the colormap
示例 1:
import matplotlib.pyplot as plt
import numpy as np
import matplotlib.colors

a = np.linspace(-3, 3)
A, B = np.meshgrid(a, a)
X = np.exp(-(A**2 + B**2))
figure, (axes1, axes2) = plt.subplots(ncols = 2)

colors =["green", "orange",
         "gold", "blue", "k",
        "#550011", "purple",
         "red"]

axes1.set_title(" color list")
contour = axes1.contourf(A, B, X,
                         colors = colors)

axes2.set_title("with colormap")
cmap = matplotlib.colors.ListedColormap(colors)
contour = axes2.contourf(A, B, X, cmap = cmap)
figure.colorbar(contour)

plt.show()
输出: 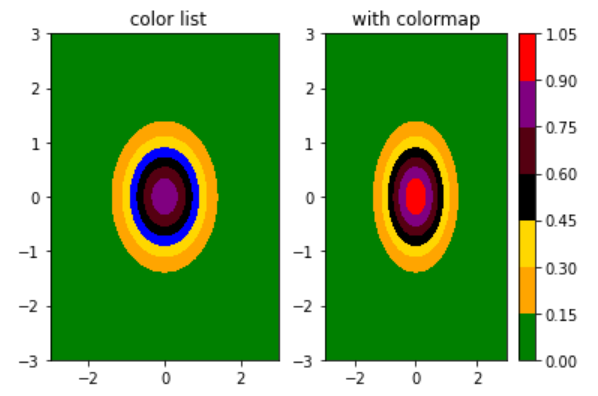
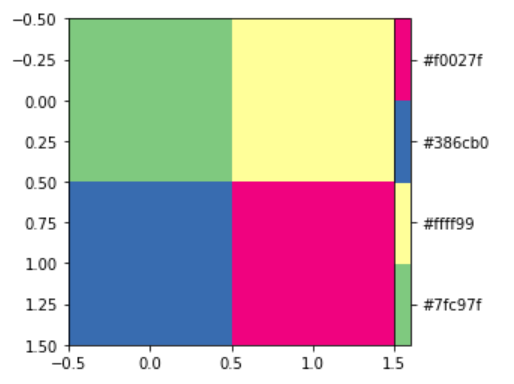
示例 2:
import matplotlib.pyplot as plt
import numpy as np
import matplotlib.colors as colors
from mpl_toolkits.axes_grid1 import make_axes_locatable

res = np.array([[0, 2], [3, 4]], dtype = int)

u = np.unique(res)
bounds = np.concatenate(([res.min()-1],
                         u[:-1]+np.diff(u)/2.,
                         [res.max()+1]))

norm = colors.BoundaryNorm(bounds, len(bounds)-1)
color_map1 = ['#7fc97f', '#ffff99',
              '#386cb0', '#f0027f']
color_map = colors.ListedColormap(color_map1)

fig, axes = plt.subplots()
img = axes.imshow(res, cmap = color_map,
                  norm = norm)
divider = make_axes_locatable(axes)
cax = divider.append_axes("right", size ="5 %")

color_bar = plt.colorbar(img, cmap = color_map,
                         norm = norm, cax = cax)

color_bar.set_ticks(bounds[:-1]+np.diff(bounds)/2.)
color_bar.ax.set_yticklabels(color_map1)
color_bar.ax.tick_params(labelsize = 10)

plt.show()
输出: