Python中的 Matplotlib.colors.SymLogNorm 类
Matplotlib是Python中用于数组二维图的惊人可视化库。 Matplotlib 是一个基于 NumPy 数组构建的多平台数据可视化库,旨在与更广泛的 SciPy 堆栈配合使用。
注意:有关更多信息,请参阅Python Matplotlib - 概述
matplotlib.colors.SysLogNorm
matplotlib.colors.SysLogNorm类属于matplotlib.colors模块。 matplotlib.colors 模块用于将颜色或数字参数转换为 RGBA 或 RGB。该模块用于将数字映射到颜色或在一维颜色数组(也称为颜色图)中进行颜色规范转换。
matplotlib.colors.SymLogNorm 类用于从原点到正负方向的对称对数缩放。由于接近零范围的值趋于无穷大,因此需要在零附近有一个线性范围。绘图呈线性的范围称为 linthresh。在 linscale 的帮助下,线性范围(-linthresh 到 +linthresh)相对于对数范围被拉伸。线性范围的每一半使用的十进制数就是它的值。例如,如果 linscale==1.0(这也是默认值),则线性范围的正负半部分所覆盖的空间相当于本质上对数范围内的十进制。
类的方法:
- autoscale(self, A):用于设置A的Vmax和Vmin。
- autoscale_None(self, A):用于自动缩放以 None 为值的 vmax vmin。
- inverse(self, value):它返回值的对数倒数。
示例 1:
Python3
import numpy as np
import matplotlib.pyplot as plt
import matplotlib.colors as colors


# SymLogNorm: two humps, one
# negative and one positive
N = 100
A, B = np.mgrid[-3:3:complex(0, N), -2:2:complex(0, N)]
C1 = np.exp(-A**2 - B**2)
C2 = np.exp(-(A - 1)**2 - (B - 1)**2)
C = (C1 - C2) * 2

figure, axes = plt.subplots(2, 1)

pcm = axes[0].pcolormesh(A, B, C,
                       norm = colors.SymLogNorm(linthresh = 0.03,
                                                linscale = 0.03,
                                                vmin =-1.0,
                                                vmax = 1.0),
                       cmap ='RdBu_r')

figure.colorbar(pcm, ax = axes[0], extend ='both')

pcm = axes[1].pcolormesh(A, B, C,
                         cmap ='RdBu_r',
                         vmin =-np.max(C))

figure.colorbar(pcm, ax = axes[1],
                extend ='both')

plt.show()
Python3
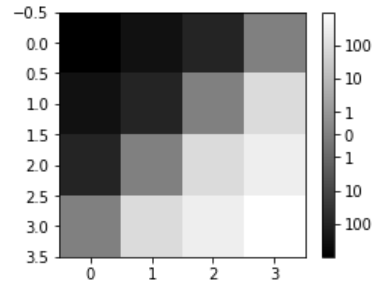
import numpy as np
import matplotlib.pyplot as plt
from matplotlib import colors, ticker

# helper function to
# show syslognorm in action
def symlog(arr, vmin = None, vmax = None,
           logthresh = 5, logstep = 1,
           linscale = 1, **kwargs):

    vmin = arr.min() if vmin is None else vmin
    vmax = arr.max() if vmax is None else vmax
    image = plt.imshow(arr,
                       vmin = float(vmin),
                       vmax = float(vmax),
                       norm = colors.SymLogNorm(10**-logthresh,
                                                linscale = linscale),
                       **kwargs)

    maxlog = int(np.ceil(np.log10(vmax)))
    minlog = int(np.ceil(np.log10(-vmin)))

    # generate logarithmic ticks
    tick_locations =([-(10**x) for x in range(-logthresh,
                                             minlog + 1,
                                             logstep)][::-1]
                    +[0.0]
                    +[(10**x) for x in range(-logthresh,
                                             maxlog + 1,
                                             logstep)] )

    cb = plt.colorbar(ticks = tick_locations,
                    format = ticker.LogFormatter())

    return image, cb

data = np.arange(4).reshape(-1, 1)+np.arange(4).reshape(1, -1)
data = 10**(data / 2.)
data2 = data - data[::-1, ::-1]
plt.figure(figsize =(4, 3))
image, cb = symlog(data2, interpolation ="None",
                   cmap ="gray", logthresh = 0)
plt.show()输出: 
示例 2:
Python3
import numpy as np
import matplotlib.pyplot as plt
from matplotlib import colors, ticker

# helper function to
# show syslognorm in action
def symlog(arr, vmin = None, vmax = None,
           logthresh = 5, logstep = 1,
           linscale = 1, **kwargs):

    vmin = arr.min() if vmin is None else vmin
    vmax = arr.max() if vmax is None else vmax
    image = plt.imshow(arr,
                       vmin = float(vmin),
                       vmax = float(vmax),
                       norm = colors.SymLogNorm(10**-logthresh,
                                                linscale = linscale),
                       **kwargs)

    maxlog = int(np.ceil(np.log10(vmax)))
    minlog = int(np.ceil(np.log10(-vmin)))

    # generate logarithmic ticks
    tick_locations =([-(10**x) for x in range(-logthresh,
                                             minlog + 1,
                                             logstep)][::-1]
                    +[0.0]
                    +[(10**x) for x in range(-logthresh,
                                             maxlog + 1,
                                             logstep)] )

    cb = plt.colorbar(ticks = tick_locations,
                    format = ticker.LogFormatter())

    return image, cb

data = np.arange(4).reshape(-1, 1)+np.arange(4).reshape(1, -1)
data = 10**(data / 2.)
data2 = data - data[::-1, ::-1]
plt.figure(figsize =(4, 3))
image, cb = symlog(data2, interpolation ="None",
                   cmap ="gray", logthresh = 0)
plt.show()
输出: