Python中的 Matplotlib.colors.TwoSlopeNorm 类
Matplotlib是Python中用于数组二维图的惊人可视化库。 Matplotlib 是一个基于 NumPy 数组的多平台数据可视化库,旨在与更广泛的 SciPy 堆栈一起使用。
Matplotlib.colors.TwoSlopeNorm
matplotlib.colors.TwoSlopeNorm 类用于使用设置的中心对数据进行归一化。在绘制概念中心周围变化率不等的数据时,它会派上用场。例如,-3 到 6 之间的范围以 0 为中心。
Syntax: class matplotlib.colors.TwoSlopeNorm(vcenter, vmin=None, vmax=None)
Parameters:
- vcenter: It holds a float value that defines 0.5 in normalization.
- vmin: This is an optional parameter that defines the data value 0.0 in normalization. It defaults to minimum value of the dataset.
- vmax: This is an optional parameter that defines the data value 1.0 in normalization. It defaults to maximum value of the dataset.
上课方法:
- autoscale_none(self, A):此方法用于通过获取 vmax 和 vmin 在 vcenter 处进行剪辑。
示例 1:
Python3
import numpy as np
import matplotlib.pyplot as plt
import matplotlib.cbook as cbook
import matplotlib.colors as colors
file = cbook.get_sample_data('topobathy.npz',
asfileobj = False)
with np.load(file) as example:
topo = example['topo']
longi = example['longitude']
latit = example['latitude']
figure, axes = plt.subplots(constrained_layout = True)
# creating a colormap that has land
# and ocean clearly delineated and
# of the same length (256 + 256)
undersea = plt.cm.terrain(np.linspace(0, 0.17, 256))
land = plt.cm.terrain(np.linspace(0.25, 1, 256))
every_colors = np.vstack((undersea, land))
terrain_map = colors.LinearSegmentedColormap.from_list('terrain_map',
every_colors)
# the center is offset so that
# the land has more dynamic range
# while making the norm
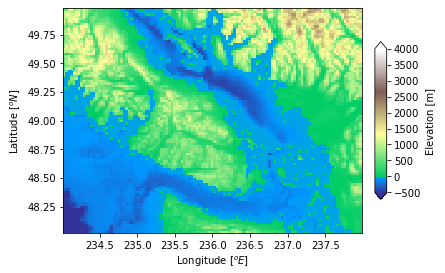
diversity_norm = colors.TwoSlopeNorm(vmin =-500,
vcenter = 0,
vmax = 4000)
pcm = axes.pcolormesh(longi, latit, topo,
rasterized = True,
norm = diversity_norm,
cmap = terrain_map, )
axes.set_xlabel('Longitude $[^o E]$')
axes.set_ylabel('Latitude $[^o N]$')
axes.set_aspect(1 / np.cos(np.deg2rad(49)))
figure.colorbar(pcm, shrink = 0.6, extend ='both',
label ='Elevation [m]')
plt.show()Python3
import numpy as np
import matplotlib.pyplot as plt
import matplotlib.colors as mcolors

data = np.random.normal(.4, 2, (10, 10))

two_slope_norm = mcolors.TwoSlopeNorm(vmin = data.min(),
                                      vmax = data.max(),
                                      vcenter = 0)

plt.imshow(data, cmap = plt.cm.RdBu,
           norm = two_slope_norm)

plt.colorbar()
plt.show()
输出:
示例 2:
Python3
import numpy as np
import matplotlib.pyplot as plt
import matplotlib.colors as mcolors

data = np.random.normal(.4, 2, (10, 10))

two_slope_norm = mcolors.TwoSlopeNorm(vmin = data.min(),
                                      vmax = data.max(),
                                      vcenter = 0)

plt.imshow(data, cmap = plt.cm.RdBu,
           norm = two_slope_norm)

plt.colorbar()
plt.show()
输出:
