问题1.下表显示了不同年份出院并诊断出HIV的患者人数:
| Years | 2002 | 2003 | 2004 | 2005 | 2006 |
| Number of Patients | 150 | 170 | 195 | 225 | 230 |
用图形表示信息。
解决方案:
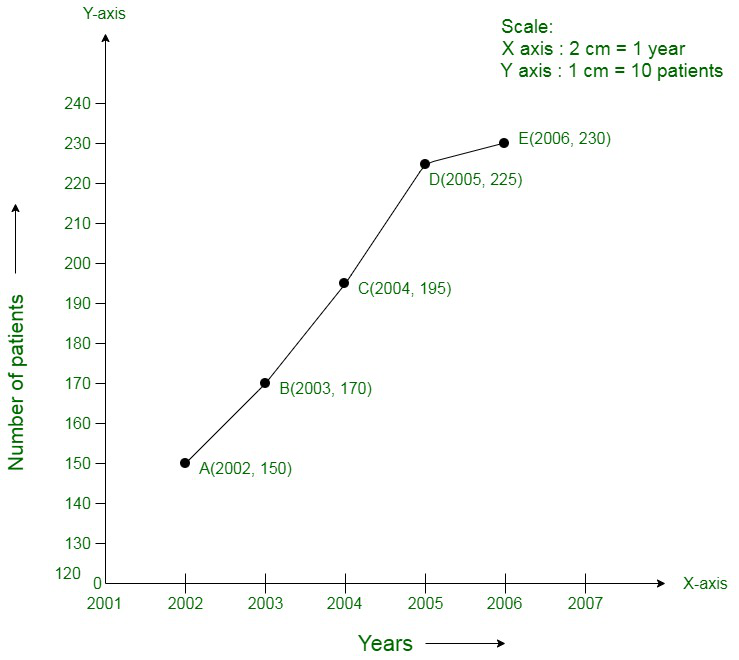
From the question as we know that,
The number of patients – is a dependent variable.
Year – is an independent variable.
Take years on x-axis
and Number of patients on y – axis
Choose the following scale:
X – axis: 2 cm = 1 year
Y – axis: 1 cm = 10 patients
Consider that on the x-axis, origin (O) represents 2001 and on the y-axis, origin (O) represents 120,
i.e. O (2001, 120).
Now, Plot
(2002, 150),
(2003, 170),
(2004, 195),
(2005, 225),
(2006, 230).
Join these points in the following graph as shown below.

问题2.下表显示了农民在不同年份种植的水稻数量:
| Years | 2000 | 2001 | 2002 | 2003 | 2004 | 2005 | 2006 |
| Rice grown (in quintals) | 200 | 180 | 240 | 260 | 250 | 200 | 270 |
绘制图表以说明此信息。
解决方案:
From the question as we know that,
Year – is an independent variable
Quantity of rice grown is a dependent variable.
So, take
Year on X – axis
Quantity of rice grown on Y – axis
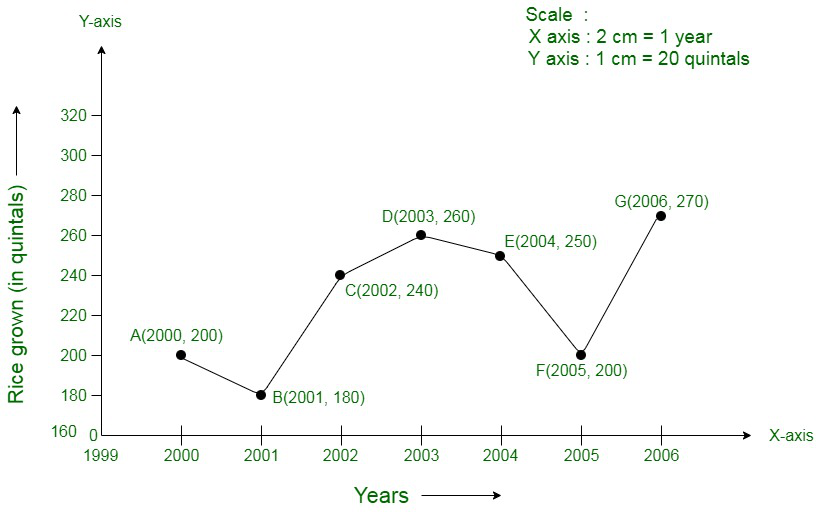
Choose following scale:
X – axis: 2 cm = 1 year
Y – axis: 1 cm = 20 quintals
Consider that the origin O represents the coordinates (1999, 160).
i.e. O (1999,160)
Now, Plot
(2000, 200),
(2001, 180),
(2002, 240),
(2003, 260),
(2004, 250),
(2005, 200),
(2006, 270).
Join these points on the following graph as shown below:

问题3.下表提供了有关从事某项工作的人数和完成工作所花费的时间的信息:
| Number of persons | 2 | 4 | 6 | 8 |
| Time taken (in days) | 12 | 6 | 4 | 3 |
绘制此信息的图表。
解决方案:
From the question as we know that,
The number of persons – is an independent variable
Time taken – is a dependent variable.
So, take
The number of persons on the X – axis
Time taken on the Y – axis.
Choose following scale:
X – axis: 2 cm = 2 persons
Y – axis: 2 cm = 2 days
Now, plot
(2, 12),
(4, 6),
(6, 4),
(8, 3).
Join these points on the following graph as shown below:

问题4.下表提供有关正方形边长及其面积的信息
| Length of a side (in cm) | 1 | 2 | 3 | 4 | 5 |
| Area of square (in cm2) | 1 | 4 | 9 | 16 | 25 |
绘制图表以说明此信息。
解决方案:
From the question as we know that,
Length of a side – is an independent variable
Area of the square – is a dependent variable.
So, take
Length of a side on the X – axis
Area of the square on the Y – axis.
Choose following scale:
X – axis: 2 cm = 1 cm
Y – axis: 1 cm = 2 cm2
Now, plot
(1, 1),
(2, 4),
(3, 9),
(4, 16),
(5, 25).
Join these points in the following graph as shown below:

问题5.下表显示了2000年至2006年期间一种商品的销售额。
| Years | 2000 | 2001 | 2002 | 2003 | 2004 | 2005 | 2006 |
| Sales (in lakhs of Rs) | 1.5 | 1.8 | 2.4 | 3.2 | 5.4 | 7.8 | 8.6 |
绘制此信息的图表。
解决方案:
From the question as we know that,
Year – is an independent variable
Sales – is a dependent variable.
So, take
Year on the X – axis
Sales on the Y – axis.
Choose following scale:
X – axis: 2 cm = 1 year
Y – axis: 2 cm = 1 lakh rupees
Consider that on x-axis, origin (O) represents 1991.
Hence, the coordinates of O are (1991, 0).
Now, plot
(2000, 1.5),
(2001, 1.8),
(2002, 2.4),
(2003, 3.2),
(2004, 5.4),
(2005, 7.8)
(2006, 8.6).
Join these points on the following graph as shown below;

问题6.在以下每种情况下绘制温度-时间图:
(一世)
| Time (in hours) | 7:00 | 9:00 | 11:00 | 13:00 | 15:00 | 17:00 | 19:00 | 21:00 |
| Temperature (in oF) | 100 | 101 | 104 | 102 | 100 | 99 | 100 | 98 |
(ii)
| Time (in hours) | 8:00 | 10:00 | 12:00 | 14:00 | 16:00 | 18:00 | 20:00 |
| Temperature (in oF) | 100 | 101 | 104 | 103 | 99 | 98 | 100 |
解决方案:
(i) From the question as we know that,
Time – is an independent variable
Temperature – is a dependent variable.
So, take
Time on the X – axis
Temperature on the Y – axis.
Choose following scale:
X – axis: 1 cm = 1 hour
Y – axis: 1 cm = 1°F
Consider that on the x-axis, the coordinate of origin is 6:00.
On y-axis, the coordinate of origin is 94°F.
Hence, the coordinates of 0 are (6:00, 94).
Now, plot
(7:00, 100),
(9:00, 101),
(11:00, 104)
(21:00, 98)
Join these points on the following graph as shown below:

(ii) From the question we know that,
Time – is an independent variable
Temperature – is a dependent variable.
So, take
Time on the X – axis
Temperature on the Y – axis.
Choose following scale:
X – axis: 2 cm = 2 hours
Y – axis: 1 cm = 1°F
Consider that on the x-axis, the coordinate of origin is 6:00.
On y-axis, the coordinate of origin is 94°F.
Thus, the coordinates of 0 are (6:00, 94).
Now, plot
(8:00, 100),
(10:00, 101),
(12:00, 104)…..
(20:00, 100).
Join these points on the graph as shown below:

问题7.从以下数据绘制速度-时间图:
| Time (in hours) | 7:00 | 8:00 | 9:00 | 10:00 | 11:00 | 12:00 | 13:00 | 14:00 |
| Speed (in km/hr) | 30 | 45 | 60 | 50 | 70 | 50 | 40 | 45 |
解决方案:
From the question as we know that,
Time – is an independent variable.
Speed – is a dependent variable.
So, take
Time on the X – axis
Speed on the Y – axis.
Choose following scale:
X – axis: 2 big division = 1 hour
Y – axis: 1 big division = 10 km/hr
Consider that on the x-axis, the coordinate of origin (O) is 7:00.
Thus, the coordinates of O are (7:00, 0).
Now, plot
(7:00, 30),
(8:00, 45),
(9:00, 60),
(10:00, 50),
(11:00, 70),
(12:00, 50),
(13:00, 40),
(14:00, 45).
Join these points on the graph as shown below:

问题8 :板球队在前15次得分中的得分如下:
| Overs: | I | II | III | IV | V | VI | VII | VIII | IX | X | XI | XII | XIII | XIV | XV |
| Runs: | 2 | 1 | 4 | 2 | 6 | 8 | 10 | 21 | 5 | 8 | 3 | 2 | 6 | 8 | 12 |
以两种不同的方式绘制表示上述数据的图形,分别为图形和条形图。
解决方案:
From the question as we know that,
Over – is an independent variable.
Run is a dependent variable.
So, take
Overs on the X – axis
Runs on the Y – axis.
Choose following scale:
X – axis: 1 cm = 1 over
Y – axis: 1 cm = 2 runs
Now, plot
(I, 2),
(II, 1),
(III, 4)…
(XV, 12).
Join these points on graph as shown below:

The bar graph is:

问题9.以下是两个A队和B队在前10场比赛中得分的结果:
| Overs | I | II | III | IV | V | VI | VII | VIII | IX | X |
| Team A | 2 | 1 | 8 | 9 | 4 | 5 | 6 | 10 | 6 | 2 |
| Team B | 5 | 6 | 2 | 10 | 5 | 6 | 3 | 4 | 8 | 10 |
绘制一个描述数据的图形,并以两种不同的方式将图形分别绘制在同一根轴上,以图形和条形图的形式。
解决方案:
From the question as we know that,
Over – is an independent variable.
Run – is a dependent variable.
So, take
Overs on X – axis
Runs on the Y – axis.
Choose following scale:
X – axis: 1 cm = 1 over
Y – axis: 1 cm = 1 run
Now, plot
(I, 2),
(II, 1),
(III, 8)…
(X, 2) for team A
and
(I, 5),
(II, 6),
(III, 8) …..
(X, 10) for team B.
Join these points on graph as shown below:

The bar graph is:
