线性方程是一阶方程,即度数为1的方程。用于定义任何直线的方程都是线性的,它们表示为:
x + k = 0;
这些方程式具有独特的解决方案,可以很容易地在数字线上表示。让我们看一下两个变量中的线性方程,它们的表示方式,图形和解决方案。
两个变量中的线性方程表示为:
ax + by = c,
其中a,b和c是实数。
例如: 3x + 5y = 6是两个变量的线性方程式的示例。
线性方程的解
线性方程的解是满足给定方程的点(x,y)。让我们看一个例子
x + y = 4
我们将研究该方程的解。
x = 2和y = 2是该方程的解,因此x = 0且y = 4和(4,0)。我们有三个点可以满足这个方程式。但是有超过三点。对于x的每个值或y的值,我们可能会得到另一个变量的值。这表明该方程式有无限多种可能的解。
因此,两个变量中的线性方程具有无限多个解。如果将这些解决方案绘制在图形上,它们的外观如何?让我们看一下线性方程的图形。
引言中介绍的方程式,即一个变量中的线性方程式,也可以用这种形式表示。让我们看一个例子
问题1:将以下线性方程式表示为一个标准的两变量线性方程式,用一个变量表示。
x + 6 = 0
回答:
We need to bring it in the standard two variable linear equation form,
ax + by + c = 0
x + 6 = 0
Can be re-written as,
1.x + 0.y + 6 = 0.
现在我们需要看看如何在现实生活中公式化这些方程式。
问题2:埃里克(Eric)和凯尔(Kyle)去万圣节糖果店买一些糖果,在万圣节“捣蛋”。埃里克(Eric)购买了6个可乐糖果,凯尔(Kyle)购买了10个酸甜的牙齿糖果。店主要求所有糖果的价格为150卢比。为这种情况制定方程式,以找出可乐和酸甜糖果的价格。
回答:
Let’s say cost of Cola candy is “x” and cost of “Sour-Sweet” candy is “y”. Notice that problem has two variables, so we will have to formulate linear equation in two variables to represent this equation.
Cost of 6 cola candies = 6x,
Cost of 10 Sour-Sweet candies = 10y
Total Cost = Cost of 6 cola candies. + Cost of 10 Sour-sweet Candies.
150 = 6x + 10y
Thus, this is our required equation.
线性方程图
绘制线性方程式的图形以获得直线,在两个轴的坐标的帮助下绘制它们,在图形上获得这样的对,并尝试从中创建图案会给我们直线。在给定的线性方程中,放置不同的x值以获得不同的y值,例如,获得的对为(x 1 ,y 1 ),(x 2 ,y 2 ),(x 3 ,y 3 )…等等。现在将这些点绘制在图形上以获得直线。
绘制点
以下是在图形上绘制点的步骤:
步骤1:选取x的不同值
步骤2:将这些值代入给定的方程式以求解y的值
步骤3:在图表上绘制获得的各个对
步骤4:获取这样的对(至少两个或两个以上)将有助于我们确定直线的走向。
查找X和Y拦截
以下是查找x和y截距的步骤:
步骤1:为了找到y截距,将x设置为0,并求解y的值
步骤2:为了找到x截距,设置y = 0,并求解x的值
第3步:在图形上绘制两个点,并用一条直线将它们连接起来。
样本问题
问题1:绘制方程式图,
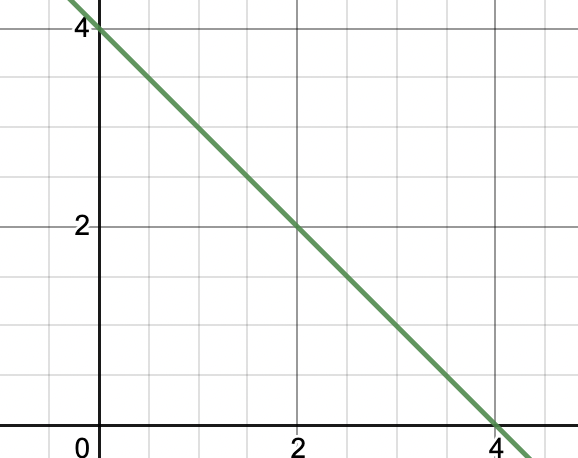
x + y = 4
解决方案:
Let’s list out the solutions of this equation.
| x | 0 | 1 | 2 | 3 | 4 | 5 | … |
| y | 4 | 3 | 2 | 1 | 0 | -1 | … |
If we keep on listing these solutions, we will see that they form a straight line. Let’s plot that line of the graph.

问题2:绘制方程式的图形,
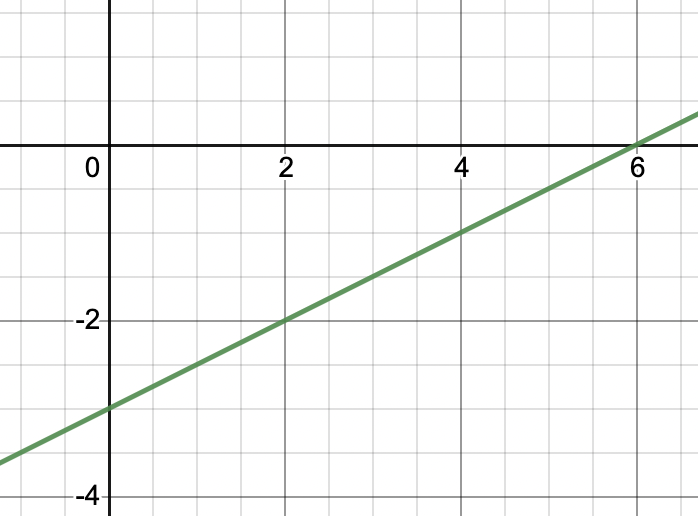
2x – 4y = 12
解决方案:
Let’s list out the solutions to this equation,
| x | 0 | 1 | 2 | 3 | 4 |
| y | -3 | -2.5 | -2 | -1.5 | -1 |
We can join any of two these points to get the line.

让我们看一些平行于x轴和y轴的线性方程的示例。
问题3:绘制以下方程式的图。
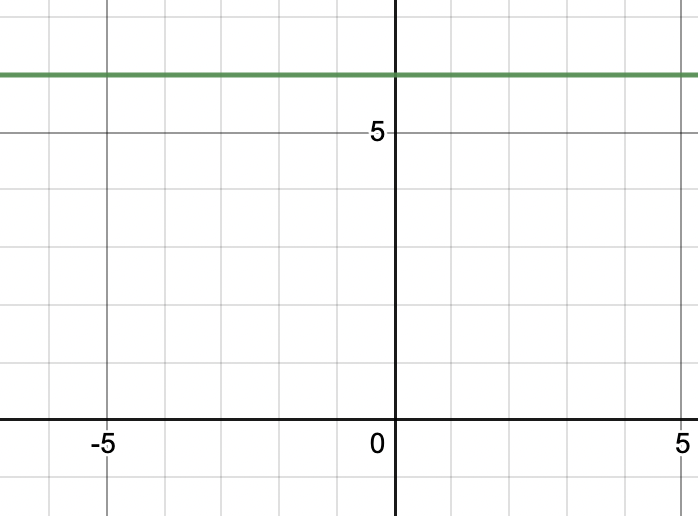
y = 6
解决方案:
The equation when written in the form of linear equation in two variables.
0.x + 1.y = 6
We can see that it doesn’t matter what value of “x” we put in, it won’t affect the equation. So, to satisfy the equation value of “y” must be 6. Thus, our solution must have y = 6 and any other value of “x” will work.
So, the graph will look like this,

Notice that this graph is parallel to x -axis.
问题4:绘制以下方程式的图。
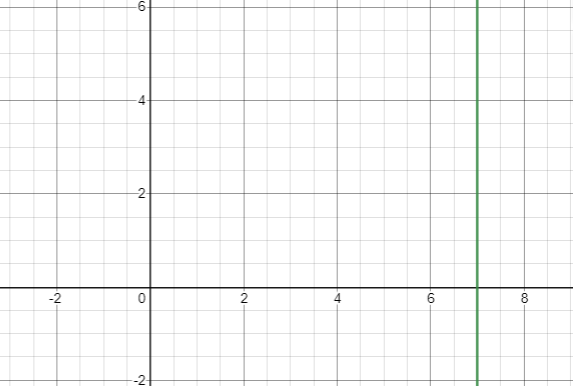
x = 7
解决方案:
Similar to above question, this equation can be represented as.
1.x + 0.y = 7
Here, value of “y” doesn’t matter and the value of “x” must be 7.
So, plotting this on the graph.

Thus, this is graph for x = 4.
Note: In general for any equation x = k, the graph will always be parallel to the y-axis. Similarly, the equation for y = k, the graph will always be parallel to the x-axis.