在 R 中绘制累积分布函数
在本文中,我们将讨论如何在 R 编程语言中绘制累积分布函数(CDF)。
在 x 处评估的随机变量的累积分布函数(CDF) 是 x 取值小于或等于 x 的概率。为了计算 R 语言中的累积分布函数,我们使用 ecdf()函数。 R 语言中的 ecdf()函数用于计算和绘制数值向量的经验累积分布函数的值。 ecdf()函数将数据向量作为参数并返回 CDF 数据。
Syntax: ecdf( data_vector )
Parameter:
- data_vector: determines the vector that contains data for CDF calculation.
在基础 R 中绘制累积分布函数
为了在基数 R 中绘制 CDF函数,我们首先使用 ecdf()函数计算 CDF。然后我们使用 plot()函数在 R 语言中绘制 CDF 图。 plot函数将 ecdf()函数的结果作为参数来绘制 CDF 图。
Syntax: plot( CDF )
Parameter:
- CDF: determines the cumulative distribution function calculated using the ecdf() function.
示例 1:基数 R 中的累积分布函数
这是 R 语言中基本累积分布函数图的示例。
R
# create sample data
sample_Data = rnorm(500)

# calculate CDF
CDF <- ecdf(sample_Data )

# draw the cdf plot
plot( CDF )
R
head(iris)
plot(ecdf(iris$Petal.Length))
R
# plot normal CDF plot
curve(pnorm, from = -10, to = 10)
R
# load library ggplot2
library(ggplot2)

# create sample dataframe for upper and lower limit
sample_limit<- data.frame(x = c(-10, 10))

# draw CDF Plot
ggplot(sample_limit, aes(x = x)) +
                  stat_function(fun = pnorm)
输出:

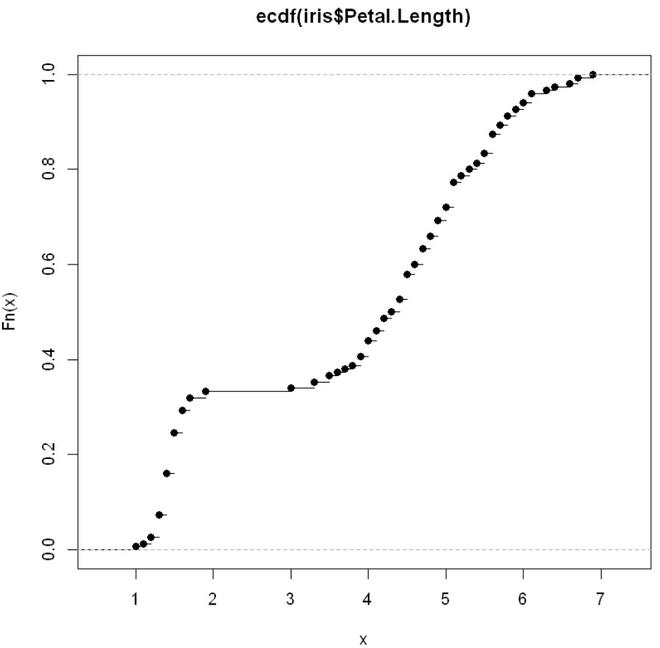
示例 2:使用 iris 数据集的基础 R中的累积分布函数
R
head(iris)
plot(ecdf(iris$Petal.Length))
输出:
绘制已知分布的 CDF
为了绘制特定已知范围内标准分布的累积分布函数,我们使用 R 语言中的 curve()函数。 curve()函数在区间上绘制对应于函数的曲线。它接受一个表达式作为参数,在这种情况下将是 pnorm 以及 from 和 to 的限制,并返回一个 Normal CDF Plot。
Syntax: curve( expression, from, to )
Parameters:
- expression: determines the expression function for CDF calculation.
- from: determines the lower limit of data.
- to: determines the upper limit of data.
例子:
这是一个普通 CDF 图的示例。
R
# plot normal CDF plot
curve(pnorm, from = -10, to = 10)
输出:

使用 ggplot2 包绘制已知分布的 CDF
为了在 ggplot2 包库中绘制相同的图,我们使用 stat_function()函数。 stat_function 将表达式函数作为一个有趣的参数,并根据基本 ggplot2 图中的表达式转换曲线。
Syntax: plot + stat_function( fun )
Parameters:
- fun: determines the function for the shape of the plot.
例子:
这是使用 ggplot2 的普通 CDF 图的示例。
R
# load library ggplot2
library(ggplot2)

# create sample dataframe for upper and lower limit
sample_limit<- data.frame(x = c(-10, 10))

# draw CDF Plot
ggplot(sample_limit, aes(x = x)) +
                  stat_function(fun = pnorm)
输出:

