如何在 R 中绘制 Weibull 分布
在本文中,我们将了解如何在 R 编程语言中绘制威布尔分布。 Weibull 分布是一种连续概率分布,用于在现代机器在古代不可用时分析寿命数据、模拟故障时间和访问产品可靠性。
要在 R 中绘制 Weibull 分布,我们需要两个函数,即 dweibull 和 curve()。
- dweibull():具有参数形状和尺度的 Weibull 分布的密度、分布函数、分位数函数和随机生成。
dweibull(x, shape, scale= 1):
- x – vector of quantiles
- shape – shape parameter.
- scale – scale parameter.
- curve():在区间 [from, to] 上绘制对应于函数的曲线。曲线也可以在变量 xname 中绘制表达式,默认 x。
curve(expr, from = NULL, to = NULL)
- function – The name of a function, or a call, or an expression written as a function of x which will evaluate an object of the same length as x.
- from – the start range over which the function will be plotted.
- to – the end range over which the function will be plotted.
示例 1:
为了绘制 Weibull 分布的概率密度函数,我们必须指定形状和比例值以及曲线函数中的 from 和 to 范围,如下所示。
R
curve(dweibull(x, shape=2, scale = 1), from=0, to=5)R
curve(dweibull(x, shape=2, scale=1),
      from=0, to=5, col='blue')

curve(dweibull(x, shape=3, scale=2),
      from=0, to=7, col='red', add=TRUE)

curve(dweibull(x, shape=4, scale=3),
      from=0, to=10, col='purple', add=TRUE)
R
curve(dweibull(x, shape=3, scale = 1), from=0, to=10,
    main = 'Weibull Distribution (shape = 2, scale = 1)', # add title
    ylab = 'Density values', # change y-axis label
    lwd = 2, # increase line width to 2
    col = 'red') # change line color to steelblue

# add legend
legend(2, .7, legend=c("shape=2, scale=1"),
       col=c("red"), lty=1, cex=1.5)
输出:
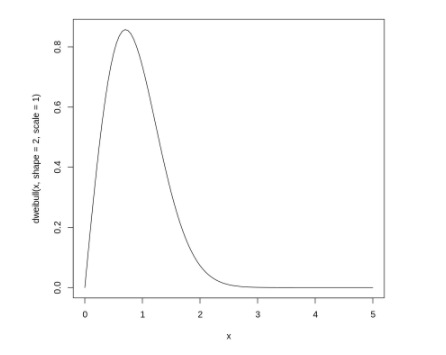
威布尔分布
示例 2:
我们还可以通过为每个分布指定不同的颜色来绘制具有不同形状、比例和范围的多个 Weibull 分布,如下所示。
R
curve(dweibull(x, shape=2, scale=1),
      from=0, to=5, col='blue')

curve(dweibull(x, shape=3, scale=2),
      from=0, to=7, col='red', add=TRUE)

curve(dweibull(x, shape=4, scale=3),
      from=0, to=10, col='purple', add=TRUE)
输出:
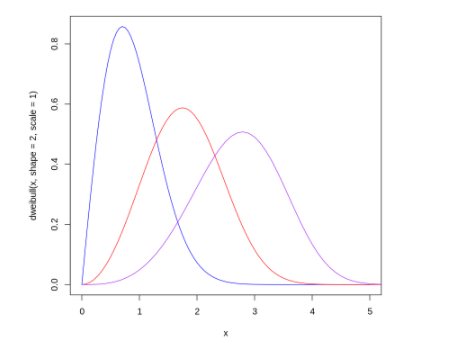
多重威布尔分布
示例 3:
我们现在可以为具有不同形状、比例和范围的 Weibull 分布添加一些美感,并包括绘图标题轴名称,如下所示。
让我们添加参数,如 main(主标题)、ylab –(y 轴标签)、lwd –(线宽)和 col(颜色)。此外,我们还可以将形状和比例值传递给图例函数,如下面的代码片段所示。
R
curve(dweibull(x, shape=3, scale = 1), from=0, to=10,
    main = 'Weibull Distribution (shape = 2, scale = 1)', # add title
    ylab = 'Density values', # change y-axis label
    lwd = 2, # increase line width to 2
    col = 'red') # change line color to steelblue

# add legend
legend(2, .7, legend=c("shape=2, scale=1"),
       col=c("red"), lty=1, cex=1.5)
输出:
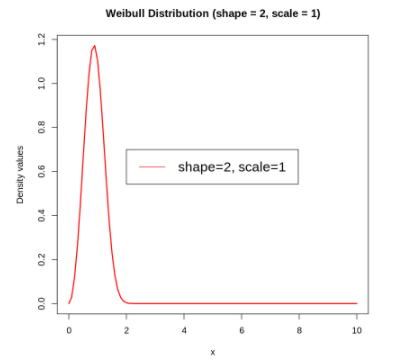
带有 x 和 y 轴名称和图例的 Weibull 分布