- Bokeh-圆形字形
- Bokeh-圆形字形(1)
- 使用 Bokeh 在Python中制作圆形字形(1)
- 使用 Bokeh 在Python中制作圆形字形
- Python Bokeh – 在谷歌地图上绘制字形
- Python Bokeh – 在谷歌地图上绘制字形(1)
- 使用Python Bokeh 创建具有多个字形的绘图(1)
- 使用Python Bokeh 创建具有多个字形的绘图
- Bokeh-轴
- Bokeh-轴(1)
- 字形日期图标 (1)
- Bokeh-使用Bokeh子命令(1)
- Bokeh-使用Bokeh子命令
- Bokeh-扩展Bokeh
- Bokeh-扩展Bokeh(1)
- 字形日期图标 - 任何代码示例
- 散景中的字形
- 散景中的字形(1)
- Bootstrap 中的字形图标是什么?
- python bokeh - Python (1)
- Bokeh-服务器
- Bokeh-服务器(1)
- 降价键盘字形 (1)
- Bokeh教程
- Bokeh教程(1)
- Bokeh-简介(1)
- Bokeh-简介
- Python Bokeh – 颜色类
- Python Bokeh – 颜色类(1)
📅 最后修改于: 2020-11-09 05:10:26 🧑 作者: Mango
任何图通常都由一个或多个几何形状(例如线,圆,矩形等)组成。这些形状具有有关相应数据集的可视信息。在Bokeh术语中,这些几何形状称为Gylph。使用bokeh.plotting界面构造的散景图使用一组默认的工具和样式。但是,可以使用可用的绘图工具来自定义样式。
地块类型
使用字形创建的不同类型的图如下所示-
线图
这种类型的绘图对于以直线形式可视化点沿x轴和y轴的运动很有用。它用于执行时间序列分析。
条形图
这通常用于指示数据集中特定列或字段的每个类别的计数。
补丁图
该图表示特定颜色阴影中的点的区域。这种类型的图用于区分同一数据集中的不同组。
散点图
这种类型的图用于可视化两个变量之间的关系并指示它们之间的相关强度。
通过调用Figure类的适当方法可以形成不同的字形图。 Figure对象是通过以下构造函数获得的-
from bokeh.plotting import figure
figure(**kwargs)
Figure对象可以通过各种关键字参数进行自定义。
| Sr.No | Title | Set the title for the plot |
|---|---|---|
| 1 | x_axis_label | Set title of x axis |
| 2 | y_axis_label | Set title for y axis |
| 3 | plot_width | Set width of figure |
| 4 | plot_height | Set height of figure |
线图
Figure对象的line()方法向Bokeh图添加线字形。它需要x和y参数作为数据数组来显示它们的线性关系。
from bokeh.plotting import figure, show
fig = figure()
fig.line(x,y)
show(fig)
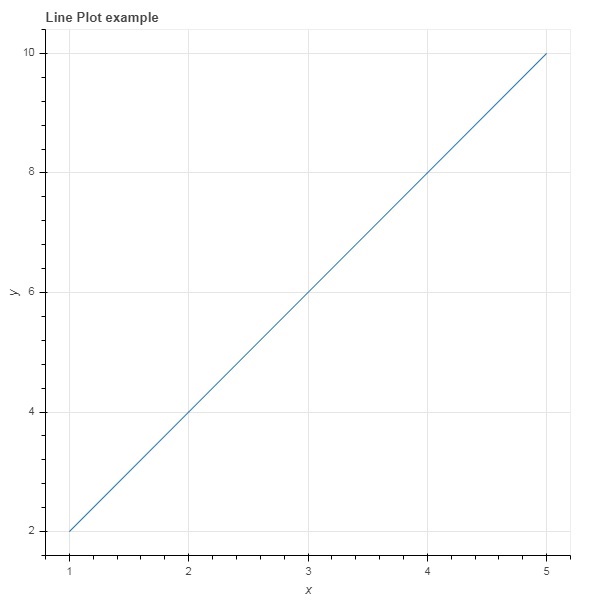
以下代码以Python列表对象的形式在两组值之间绘制简单的线条图-
from bokeh.plotting import figure, output_file, show
x = [1,2,3,4,5]
y = [2,4,6,8,10]
output_file('line.html')
fig = figure(title = 'Line Plot example', x_axis_label = 'x', y_axis_label = 'y')
fig.line(x,y)
show(fig)
输出
条形图
Figure对象具有两种不同的构造条形图的方法
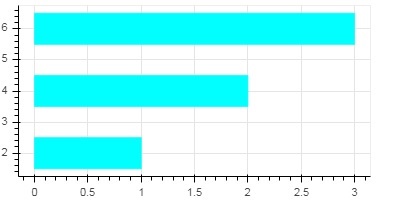
hbar()
条形图在绘图宽度上水平显示。 hbar()方法具有以下参数-
| Sr.No | y | The y coordinates of the centers of the horizontal bars. |
|---|---|---|
| 1 | height | The heights of the vertical bars. |
| 2 | right | The x coordinates of the right edges. |
| 3 | left | The x coordinates of the left edges. |
以下代码是使用散景的单杠示例。
from bokeh.plotting import figure, output_file, show
fig = figure(plot_width = 400, plot_height = 200)
fig.hbar(y = [2,4,6], height = 1, left = 0, right = [1,2,3], color = "Cyan")
output_file('bar.html')
show(fig)
输出
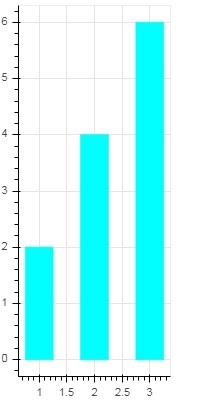
vbar()
条形图垂直显示在绘图高度上。 vbar()方法具有以下参数-
| Sr.No | x | The x-coordinates of the centers of the vertical bars. |
|---|---|---|
| 1 | width | The widths of the vertical bars. |
| 2 | top | The y-coordinates of the top edges. |
| 3 | bottom | The y-coordinates of the bottom edges. |
以下代码显示垂直条形图–
from bokeh.plotting import figure, output_file, show
fig = figure(plot_width = 200, plot_height = 400)
fig.vbar(x = [1,2,3], width = 0.5, bottom = 0, top = [2,4,6], color = "Cyan")
output_file('bar.html')
show(fig)
输出
补丁图
在Bokeh中,将以特定颜色遮盖空间区域以显示具有相似属性的区域或组的图称为斑块图。为此,Figure对象具有patch()和patch()方法。
补丁()
此方法将补丁字形添加到给定的图形。该方法具有以下参数-
| 1 | x | The x-coordinates for the points of the patch. |
| 2 | y | The y-coordinates for the points of the patch. |
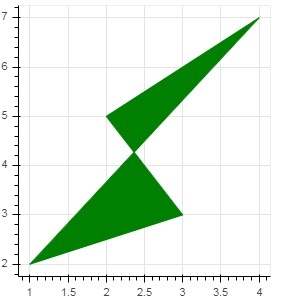
下面的Python代码获得了一个简单的补丁图–
from bokeh.plotting import figure, output_file, show
p = figure(plot_width = 300, plot_height = 300)
p.patch(x = [1, 3,2,4], y = [2,3,5,7], color = "green")
output_file('patch.html')
show(p)
输出
补丁()
此方法用于绘制多个多边形面片。它需要以下参数-
| 1 | xs | The x-coordinates for all the patches, given as a “list of lists”. |
| 2 | ys | The y-coordinates for all the patches, given as a “list of lists”. |
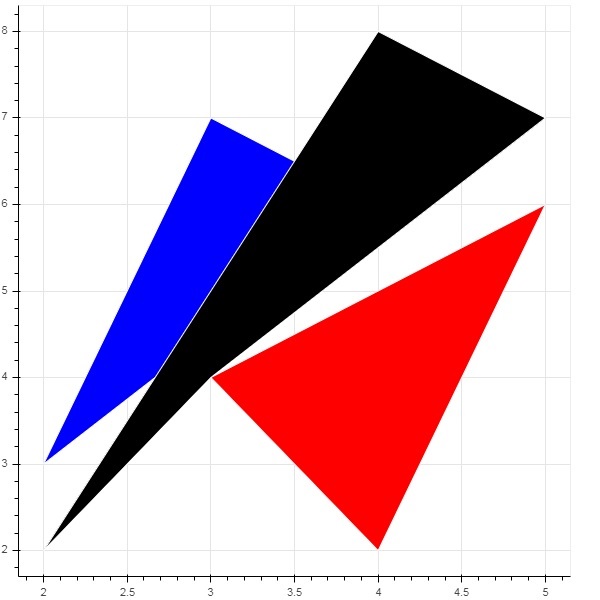
作为patch()方法的示例,运行以下代码-
from bokeh.plotting import figure, output_file, show
xs = [[5,3,4], [2,4,3], [2,3,5,4]]
ys = [[6,4,2], [3,6,7], [2,4,7,8]]
fig = figure()
fig.patches(xs, ys, fill_color = ['red', 'blue', 'black'], line_color = 'white')
output_file('patch_plot.html')
show(fig)
输出
分散标记
散点图通常用于确定两个变量之间的双变量关系。使用Bokeh将增强的交互性添加到它们中。散点图是通过调用Figure对象的scatter()方法获得的。它使用以下参数-
| 1 | x | values or field names of center x coordinates |
| 2 | y | values or field names of center y coordinates |
| 3 | size | values or field names of sizes in screen units |
| 4 | marker | values or field names of marker types |
| 5 | color | set fill and line color |
在Bokeh中定义了以下标记类型常量:-
- 星号
- 圈
- 跨圈
- CircleX
- 交叉
- 短跑
- 钻石
- 钻石穿越
- 十六进制
- 倒三角
- 广场
- SquareCross
- SquareX
- 三角形
- X
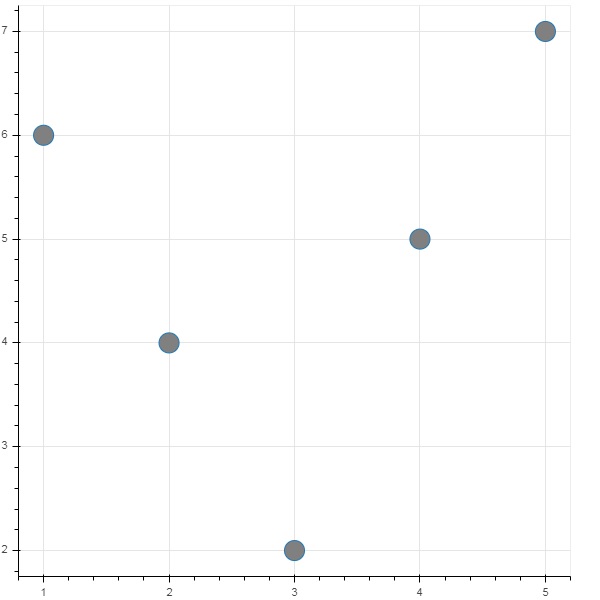
以下Python代码生成带有圆形标记的散点图。
from bokeh.plotting import figure, output_file, show
fig = figure()
fig.scatter([1, 4, 3, 2, 5], [6, 5, 2, 4, 7], marker = "circle", size = 20, fill_color = "grey")
output_file('scatter.html')
show(fig)
输出