使用 Bokeh 在Python中制作圆形字形
Bokeh是一个Python交互式数据可视化。与Matplotlib和Seaborn不同,Bokeh 使用 HTML 和 JavaScript 渲染其绘图。它针对现代 Web 浏览器进行演示,提供具有高性能交互性的新颖图形的优雅、简洁构造。
绘制圆形字形
图形对象可以绘制不同的形状,如圆形、矩形、多边形等。 Bokeh Figure 类遵循以下方法来绘制圆形字形,如下所示:
- 圆圈()
- 圆交叉()
- 圆_x()
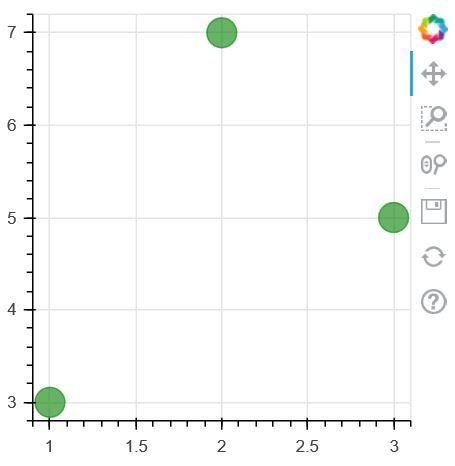
1. circle() 方法: circle() 方法用于在图形上添加圆形字形,需要其中心的 x 和 y 坐标。
Syntax: circle(x, y, *, angle=0.0, angle_units=’rad’, fill_alpha=1.0, fill_color=’gray’, line_alpha=1.0, line_cap=’butt’, line_color=’black’, line_dash=[], line_dash_offset=0, line_join=’bevel’, line_width=1, name=None, radius=None, radius_dimension=’x’, radius_units=’data’, size=4, tags=[], **kwargs)
Parameter:This method accept the following parameters that are described below:
- x: This parameter is the x-coordinates for the center of the markers.
- y: This parameter is the y-coordinates for the center of the markers.
- angle: This parameter is the angles to rotate the markers.
- fill_alpha: This parameter is the fill alpha values for the markers.
- fill_color: This parameter is the fill color values for the markers.
- radius: This parameter is the radius values for circle markers .
- radius_dimension: This parameter is the dimension to measure circle radii along.
- size: This parameter is the size (diameter) values for the markers in screen space units.
例子:
# Implementation of bokeh function

import numpy as np
from bokeh.plotting import figure, output_file, show

plot = figure(plot_width = 300, plot_height = 300)
plot.circle(x = [1, 2, 3], y = [3, 7, 5],
            size = 20, color ="green", alpha = 0.6)

show(plot)
输出: 
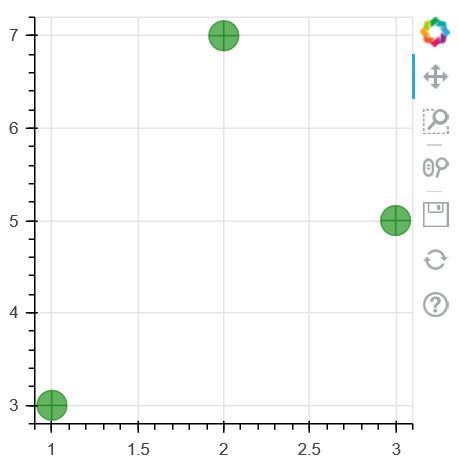
2. circle_cross() 方法: circle_cross() 方法用于在图形上添加一个带有'+' 十字的圆形字形,需要其中心的x 和y 坐标。
Syntax: circle_cross(x, y, size=4, angle=0.0, *, angle_units=’rad’, fill_alpha=1.0, fill_color=’gray’, line_alpha=1.0, line_cap=’butt’, line_color=’black’, line_dash=[], line_dash_offset=0, line_join=’bevel’, line_width=1, name=None, tags=[], **kwargs)
Parameter:This method accept the following parameters that are described below:
- x: This parameter is the x-coordinates for the center of the markers.
- y: This parameter is the y-coordinates for the center of the markers.
- angle: This parameter is the angles to rotate the markers.
- fill_alpha: This parameter is the fill alpha values for the markers.
- fill_color: This parameter is the fill color values for the markers.
- radius: This parameter is the radius values for circle markers .
- radius_dimension: This parameter is the dimension to measure circle radii along.
- size: This parameter is the size (diameter) values for the markers in screen space units.
例子:
# Implementation of bokeh function

import numpy as np
from bokeh.plotting import figure, output_file, show

plot = figure(plot_width = 300, plot_height = 300)
plot.circle_cross(x = [1, 2, 3], y = [3, 7, 5],
          size = 20, color ="green", alpha = 0.6)

show(plot)
输出: 
3. circle_x() 方法: circle_x() 方法用于添加一个圆形字形,其中'X' 十字穿过中心。到图并需要其中心的 x 和 y 坐标。
Syntax: circle_x(x, y, size=4, angle=0.0, *, angle_units=’rad’, fill_alpha=1.0, fill_color=’gray’, line_alpha=1.0, line_cap=’butt’, line_color=’black’, line_dash=[], line_dash_offset=0, line_join=’bevel’, line_width=1, name=None, tags=[], **kwargs)
Parameter:This method accept the following parameters that are described below:
- x: This parameter is the x-coordinates for the center of the markers.
- y: This parameter is the y-coordinates for the center of the markers.
- angle: This parameter is the angles to rotate the markers.
- fill_alpha: This parameter is the fill alpha values for the markers.
- fill_color: This parameter is the fill color values for the markers.
- radius: This parameter is the radius values for circle markers .
- radius_dimension: This parameter is the dimension to measure circle radii along.
- size: This parameter is the size (diameter) values for the markers in screen space units.
例子:
# Implementation of bokeh function

import numpy as np
from bokeh.plotting import figure, output_file, show

plot = figure(plot_width = 300, plot_height = 300)
plot.circle_x(x = [1, 2, 3], y = [3, 7, 5], size = 20,
         color ="green", alpha = 0.6)

show(plot)
输出: 