📌 相关文章
- Bokeh-轴
- Bokeh-使用Bokeh子命令(1)
- Bokeh-使用Bokeh子命令
- Bokeh-扩展Bokeh(1)
- Bokeh-扩展Bokeh
- 如何在java中过滤数据(1)
- 按索引过滤数据帧 (1)
- jquery 过滤数据 - Javascript (1)
- 如何在java代码示例中过滤数据
- 如何使用 javascript 过滤数据(1)
- jquery 过滤数据 - Javascript 代码示例
- 过滤数据反应图 - Javascript (1)
- python bokeh - Python (1)
- 如何使用 javascript 代码示例过滤数据
- Bokeh-服务器(1)
- Bokeh-服务器
- 使用列表过滤数据框 - Python (1)
- Bokeh教程
- Bokeh教程(1)
- 如何过滤Excel中的数据?(1)
- 如何过滤Excel中的数据?
- Firebase-过滤数据(1)
- Firebase-过滤数据
- Bokeh-简介(1)
- Bokeh-简介
- Python Bokeh – 颜色类
- Python Bokeh – 颜色类(1)
- Python | 使用Bokeh进行数据可视化
- Python – 使用 Bokeh 进行数据可视化
📜 Bokeh-过滤数据
📅 最后修改于: 2020-11-09 05:13:47 🧑 作者: Mango
通常,您可能想要获取与满足某些条件的部分数据有关的图,而不是与整个数据集有关的图。在bokeh.models模块中定义的CDSView类的对象通过在其上应用一个或多个过滤器来返回所考虑的ColumnDatasource的子集。
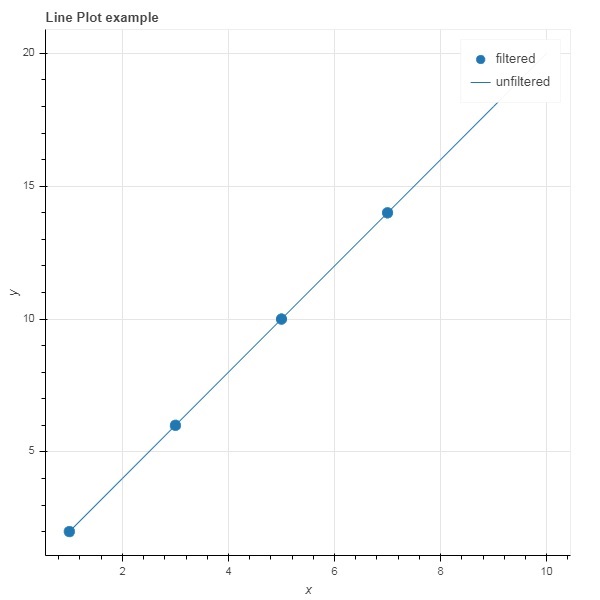
IndexFilter是最简单的过滤器类型。绘制图形时,只需指定要使用的数据集中那些行的索引。
下面的示例演示如何使用IndexFilter设置CDSView。结果图显示了ColumnDataSource的x和y数据系列之间的线字形。通过在视图对象上应用索引过滤器可以获取视图对象。该视图用于绘制作为IndexFilter结果的圆形字形。
例
from bokeh.models import ColumnDataSource, CDSView, IndexFilter
from bokeh.plotting import figure, output_file, show
source = ColumnDataSource(data = dict(x = list(range(1,11)), y = list(range(2,22,2))))
view = CDSView(source=source, filters = [IndexFilter([0, 2, 4,6])])
fig = figure(title = 'Line Plot example', x_axis_label = 'x', y_axis_label = 'y')
fig.circle(x = "x", y = "y", size = 10, source = source, view = view, legend = 'filtered')
fig.line(source.data['x'],source.data['y'], legend = 'unfiltered')
show(fig)
输出
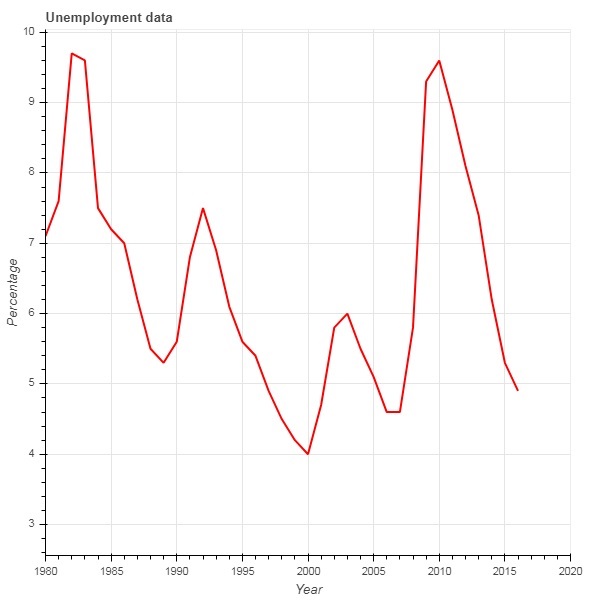
若要仅从数据源中选择满足特定布尔条件的那些行,请应用BooleanFilter。
典型的Bokeh安装由sampledata目录中的许多示例数据集组成。在下面的示例中,我们使用了失业1948.csv形式提供的失业1948数据集。它存储了自1948年以来美国每年的失业百分比。我们只想生成一个1980年以后的图。为此,可通过在给定数据源上应用BooleanFilter来获得CDSView对象。
from bokeh.models import ColumnDataSource, CDSView, BooleanFilter
from bokeh.plotting import figure, show
from bokeh.sampledata.unemployment1948 import data
source = ColumnDataSource(data)
booleans = [True if int(year) >= 1980 else False for year in
source.data['Year']]
print (booleans)
view1 = CDSView(source = source, filters=[BooleanFilter(booleans)])
p = figure(title = "Unemployment data", x_range = (1980,2020), x_axis_label = 'Year', y_axis_label='Percentage')
p.line(x = 'Year', y = 'Annual', source = source, view = view1, color = 'red', line_width = 2)
show(p)
输出
为了在应用过滤器时增加灵活性,Bokeh提供了CustomJSFilter类,可以使用用户定义的JavaScript函数过滤数据源。
下面给出的示例使用相同的美国失业数据。定义CustomJSFilter以绘制1980年及之后的失业数据。
from bokeh.models import ColumnDataSource, CDSView, CustomJSFilter
from bokeh.plotting import figure, show
from bokeh.sampledata.unemployment1948 import data
source = ColumnDataSource(data)
custom_filter = CustomJSFilter(code = '''
   var indices = [];

   for (var i = 0; i < source.get_length(); i++){
      if (parseInt(source.data['Year'][i]) > = 1980){
         indices.push(true);
      } else {
         indices.push(false);
      }
   }
   return indices;
''')
view1 = CDSView(source = source, filters = [custom_filter])
p = figure(title = "Unemployment data", x_range = (1980,2020), x_axis_label = 'Year', y_axis_label = 'Percentage')
p.line(x = 'Year', y = 'Annual', source = source, view = view1, color = 'red', line_width = 2)
show(p)