分形:
分形是曲线或几何图形,其每个部分都具有整体相同的统计字符。它们可用于对结构(例如雪花)进行建模,在该结构中类似的图案以较小的比例逐渐出现,并用于描述部分随机或混乱的现象,例如晶体生长和星系形成。
用简单的话来说,分形是永无止境的模式。分形是无限复杂的模式,它们在不同尺度上是自相似的。通过在不断进行的反馈循环中反复重复一个简单的过程来创建它们。分形是递归驱动的,是动态系统的图像-混沌的图像。
从几何上讲,它们存在于我们熟悉的尺寸之间。由于自然界中充满了分形,所以分形图案是非常熟悉的。例如:树木,河流,海岸线,山脉,云层,贝壳,飓风等。抽象分形(例如Mandelbrot集)可以通过计算机反复计算一个简单方程来生成。
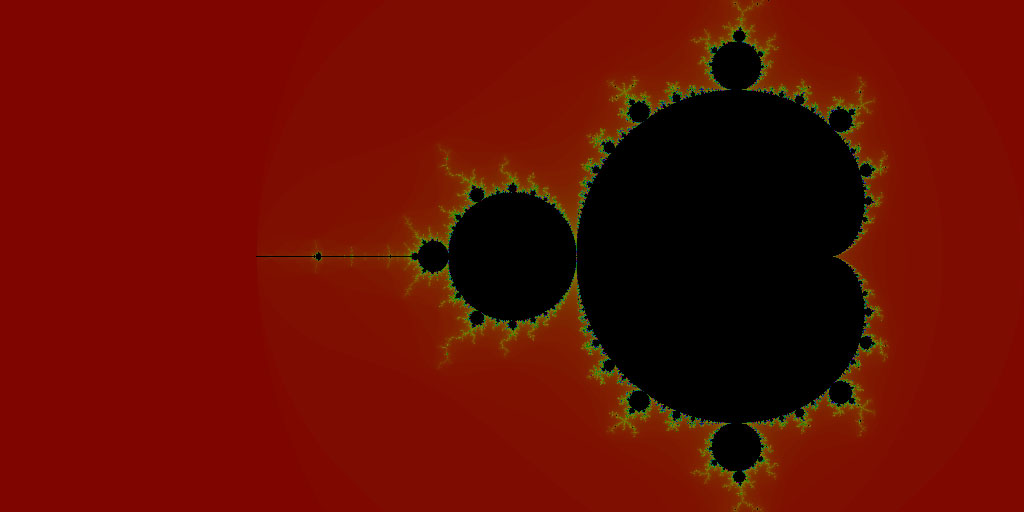
Mandelbrot套装:
Mandelbrot集是函数的复数c的函数![]() 从z = 0迭代时不发散,即序列
从z = 0迭代时不发散,即序列![]() 等等,仍然以绝对值为界。简单来说,Mandelbrot集是特定的复数集,在绘制时其分形边界非常复杂。
等等,仍然以绝对值为界。简单来说,Mandelbrot集是特定的复数集,在绘制时其分形边界非常复杂。
安装所需的Python模块:
pip install pillow
pip install numpy
代码1:
# Python code for Mandelbrot Fractal

# Import necessary libraries
from PIL import Image
from numpy import complex, array
import colorsys

# setting the width of the output image as 1024
WIDTH = 1024

# a function to return a tuple of colors
# as integer value of rgb
def rgb_conv(i):
    color = 255 * array(colorsys.hsv_to_rgb(i / 255.0, 1.0, 0.5))
    return tuple(color.astype(int))

# function defining a mandelbrot
def mandelbrot(x, y):
    c0 = complex(x, y)
    c = 0
    for i in range(1, 1000):
        if abs(c) > 2:
            return rgb_conv(i)
        c = c * c + c0
    return (0, 0, 0)

# creating the new image in RGB mode
img = Image.new('RGB', (WIDTH, int(WIDTH / 2)))
pixels = img.load()

for x in range(img.size[0]):

    # displaying the progress as percentage
    print("%.2f %%" % (x / WIDTH * 100.0))
    for y in range(img.size[1]):
        pixels[x, y] = mandelbrot((x - (0.75 * WIDTH)) / (WIDTH / 4),
                                      (y - (WIDTH / 4)) / (WIDTH / 4))

# to display the created fractal after
# completing the given number of iterations
img.show()
输出: 
代码2:
# Mandelbrot fractal
# FB - 201003254
from PIL import Image

# drawing area
xa = -2.0
xb = 1.0
ya = -1.5
yb = 1.5

# max iterations allowed
maxIt = 255

# image size
imgx = 512
imgy = 512
image = Image.new("RGB", (imgx, imgy))

for y in range(imgy):
    zy = y * (yb - ya) / (imgy - 1)  + ya
    for x in range(imgx):
        zx = x * (xb - xa) / (imgx - 1)  + xa
        z = zx + zy * 1j
        c = z
        for i in range(maxIt):
            if abs(z) > 2.0: break
            z = z * z + c
        image.putpixel((x, y), (i % 4 * 64, i % 8 * 32, i % 16 * 16))

image.show()
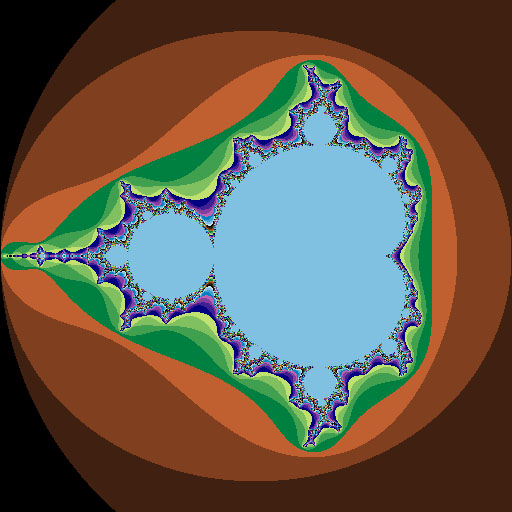
输出: 