在Python中使用 Plotly 的极坐标图
Plotly 是一个Python库,用于设计图形,尤其是交互式图形。它可以绘制各种图形和图表,如直方图、条形图、箱线图、展开图等等。它主要用于数据分析以及财务分析。 plotly 是一个交互式可视化库。
Plotly 中的极坐标图
这些图表使用极坐标系,其x轴看起来像一个以原点为中心的圆,每个点由与固定点的距离和与固定方向的角度决定。极坐标图也称为雷达图、网络图、蜘蛛图和星图等。径向和角坐标名称作为 r 和 theta 参数给出。
Syntax: plotly.graph_objects.Scatterpolar(arg=None, cliponaxis=None,dr=None, dtheta=None, line=None, marker=None,r=None, theta=None)
Parameters:
arg: dict of properties compatible with this constructor or an instance of plotly.graph_objects.Scatterpolar
r: Sets the radial coordinates
theta: Sets the radial coordinates
line: plotly.graph_objects.scatterpolar.Line instance or dict with compatible properties
marker: plotly.graph_objects.scatterpolar.Marker instance or dict with compatible properties
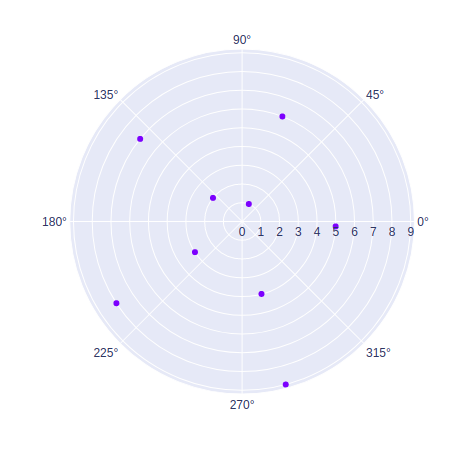
例子:
Python3
import plotly.graph_objects as go

fig = go.Figure(data=go.Scatterpolar(
    r=[1, 2, 3, 4, 5, 6, 7, 8, 9],
    theta=[69, 141, 213, 285, 357,
           429, 501, 573, 645],
    mode='markers',
))

fig.show()
Python3
import plotly.graph_objects as go

fig = go.Figure(data=go.Barpolar(
    r=[1, 2, 3, 4, 5, 6, 7, 8, 9],
    theta=[69, 141, 213, 285, 357,
           429, 501, 573, 645],
))

fig.show()
Python3
import plotly.graph_objects as go

fig = go.Figure(data=go.Scatterpolar(
    r=[1, 2, 3, 4, 5, 6, 7, 8, 9],
    theta=[69, 141, 213, 285, 357,
           429, 501, 573, 645],
    mode='lines',
))

fig.show()
输出:
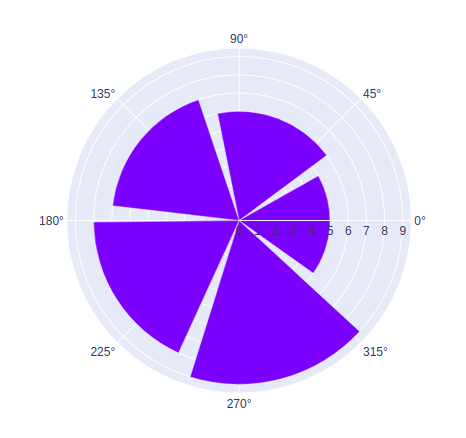
极坐标条形图
在 plotly 中,可以使用graph_object类的go.Barpolar()方法创建极坐标条形图。极坐标条形图是以分类形式显示数据的图表,x 轴在圆圈中,原点在中心。
例子:
蟒蛇3
import plotly.graph_objects as go

fig = go.Figure(data=go.Barpolar(
    r=[1, 2, 3, 4, 5, 6, 7, 8, 9],
    theta=[69, 141, 213, 285, 357,
           429, 501, 573, 645],
))

fig.show()
输出:
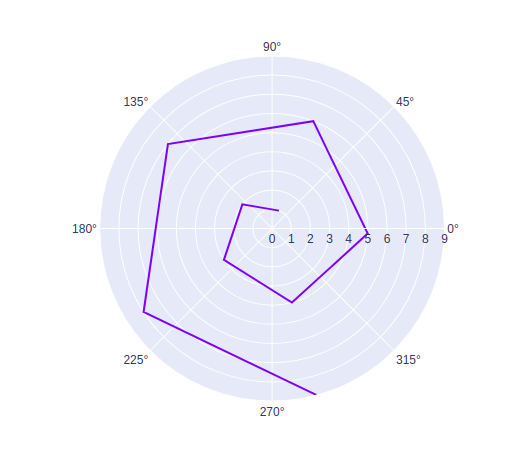
线极图
在 plotly 中,可以使用graph_object类的go.Scatterpolar()方法制作线极坐标图。折线极坐标图是一种按系列显示数据的图表,其中 x 轴位于圆圈内,原点位于中心。
例子:
蟒蛇3
import plotly.graph_objects as go

fig = go.Figure(data=go.Scatterpolar(
    r=[1, 2, 3, 4, 5, 6, 7, 8, 9],
    theta=[69, 141, 213, 285, 357,
           429, 501, 573, 645],
    mode='lines',
))

fig.show()
输出: