R 编程中的 Kolmogorov-Smirnov 检验
Kolmogorov-Smirnov 检验是一维概率分布的不连续和连续相等性的一种非参数检验,用于将样本与参考概率检验(称为单样本 KS 检验)或两个样本之间进行比较(称为两样本 KS 测试)。 KS 检验量化给定参考分布的累积分布函数与给定两个样本的经验分布之间的距离,或给定两个样本的经验分布之间的距离。在单样本 KS 检验中,在原假设下考虑的分布可以是纯离散的、连续的或混合的。在两样本 KS 检验中,在原假设下考虑的分布通常是连续分布,但在其他方面不受限制。 Kolmogorov-Smirnov 测试可以在 R 编程中非常容易地完成。
Kolmogorov-Smirnov 检验公式
Kolmogorov-Smirnov 检验的公式可以表示为:
![]()
where,
supx : the supremum of the set of distances
Fn(x) : the empirical distribution function for n id observations Xi
经验分布函数是与所选样本的经验度量相关的分布函数。作为一个阶跃函数,这个累积分布在每 n 个数据点上跳跃 1/n 步长。
R中的实现
可以使用 R 中的ks.test()函数执行 KS 测试。
Syntax:
ks.text(x, y, …, alternative = c(“two.sided”, “less”, “greater”), exact= NULL, tol= 1e-8,
simulate.p.value = FALSE, B=2000)
Parameters:
x: numeric vector of data values
y: numeric vector of data values or a character string which is used to name a cumulative distribution function.
…: the parameters which are defined by the y value
alternative: used to indicate the alternate hypothesis.
exact: usually NULL or it indicates a logic that an exact p-value should be computed.
tol: an upper bound used for rounding off errors in the data values.
simulate.p.value: a logic that checks whether to use Monte Carlo method to compute the p-value.
B: an integer value that indicates the number of replicates to be created while using the Monte Carlo method.
让我们以两个样本的 KS 测试为例,逐步了解如何执行 KS 测试。
- 第 1 步:首先安装所需的软件包。为了执行 KS 测试,我们需要使用 R 控制台中的install.packages()函数安装“ dgof ”包。
install.packages("dgof")- 第2步:成功安装包后,在我们的R脚本中加载所需的包。为此,请使用library()函数,如下所示:
R
# loading the required package
library("dgof")
R
# loading the required package
library(dgof)

# generating random variate
# sample 1
x <- rnorm(50)

# generating random deviates
# sample 2
y <- runif(30)
R
# loading the required package
library(dgof)

# generating random variate
# sample 1
x <- rnorm(50)

# generating random deviates
# sample 2
y <- runif(30)

# performing the K-S Test
# Do x and y come from
# the same distribution?
ks.test(x, y)
R
# loading the required package
library(dgof)

# sample 1
# generating a random variate
x <- rnorm(50)

# sample 2
# generating a random variate
x2 <- rnorm(50, -1)

# plotting the result
# visualization
plot(ecdf(x),
     xlim = range(c(x, x2)),
     col = "blue")
plot(ecdf(x2),
     add = TRUE,
     lty = "dashed",
     col = "red")

# performing the K-S
# Test on x and x2
ks.test(x, x2, alternative = "l")- 第 3 步:使用rnorm()函数和runif()函数生成样本x 和 y。 rnorm()函数用于生成随机变量,而runif()函数用于生成随机偏差。
R
# loading the required package
library(dgof)

# generating random variate
# sample 1
x <- rnorm(50)

# generating random deviates
# sample 2
y <- runif(30)
- 第 4 步:现在对这两个样本进行 KS 测试。为此,请使用dgof包的ks.test() 。
R
# loading the required package
library(dgof)

# generating random variate
# sample 1
x <- rnorm(50)

# generating random deviates
# sample 2
y <- runif(30)

# performing the K-S Test
# Do x and y come from
# the same distribution?
ks.test(x, y)
输出:
Two-sample Kolmogorov-Smirnov test

data:  x and y
D = 0.84, p-value = 5.151e-14
alternative hypothesis: two-sided
R 中 Kolmogorov-Smirnov 检验的可视化
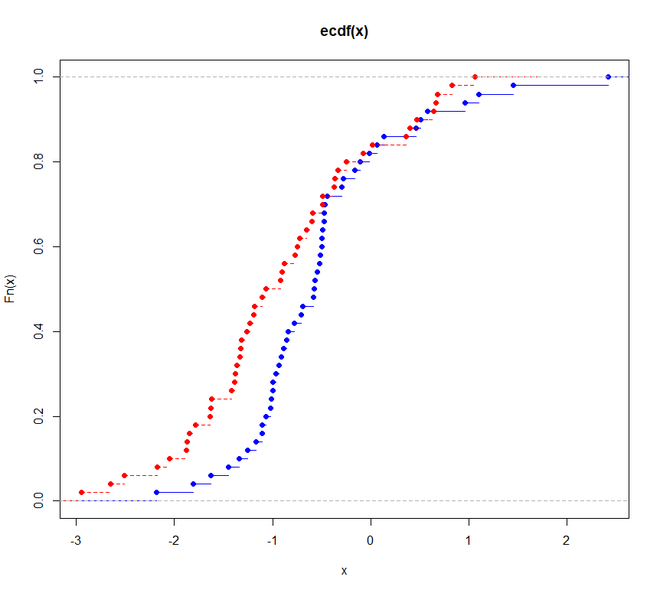
双样本KS检验对选取的两个样本的经验累积分布的形状和位置的差异非常敏感,是一种有效的非参数检验,是最普遍和有用的非参数检验之一。因此,我们将看到图表如何表示两个样本之间的差异。
例子:
在这里,我们使用rnorm()函数生成两个样本,然后绘制它们。
R
# loading the required package
library(dgof)

# sample 1
# generating a random variate
x <- rnorm(50)

# sample 2
# generating a random variate
x2 <- rnorm(50, -1)

# plotting the result
# visualization
plot(ecdf(x),
     xlim = range(c(x, x2)),
     col = "blue")
plot(ecdf(x2),
     add = TRUE,
     lty = "dashed",
     col = "red")

# performing the K-S
# Test on x and x2
ks.test(x, x2, alternative = "l")
输出:
Two-sample Kolmogorov-Smirnov test

data:  x and x2
D^- = 0.34, p-value = 0.003089
alternative hypothesis: the CDF of x lies below that of y