Python – 统计中的 Weibull 最大分布
scipy.stats.weibull_max()是 Weibull 最大连续随机变量。它作为rv_continuous 类的实例继承自泛型方法。它使用特定于此特定发行版的详细信息来完成方法。
参数 :
q : lower and upper tail probability
x : quantiles
loc : [optional]location parameter. Default = 0
scale : [optional]scale parameter. Default = 1
size : [tuple of ints, optional] shape or random variates.
moments : [optional] composed of letters [‘mvsk’]; ‘m’ = mean, ‘v’ = variance, ‘s’ = Fisher’s skew and ‘k’ = Fisher’s kurtosis. (default = ‘mv’).
Results : Weibull maximum continuous random variable
代码 #1:创建 Weibull 最大连续随机变量
# importing library

from scipy.stats import weibull_max

numargs = weibull_max .numargs
a, b = 0.2, 0.8
rv = weibull_max (a, b)

print ("RV : \n", rv)
输出 :
RV :
 scipy.stats._distn_infrastructure.rv_frozen object at 0x000002A9DA07FDC8
代码 #2:Weibull 最大连续变量和概率分布
import numpy as np
quantile = np.arange (0.01, 1, 0.1)

# Random Variates
R = weibull_max .rvs(a, b, size = 10)
print ("Random Variates : \n", R)

# PDF
x = np.linspace(weibull_max.ppf(0.01, a, b),
                weibull_max.ppf(0.99, a, b), 10)
R = weibull_max.pdf(x, 1, 3)
print ("\nProbability Distribution : \n", R)
输出 :
Random Variates :
 [ 7.99998841e-01  7.96362853e-01 -1.36808367e+00 -5.04876338e-01
 -8.07612996e+03  2.47694796e-01  7.80624490e-01  7.99996977e-01
  7.95962734e-01  6.94775447e-01]

Probability Distribution :
 [0.00000000e+000 0.00000000e+000 0.00000000e+000 0.00000000e+000
 0.00000000e+000 0.00000000e+000 1.59673931e-301 1.41364401e-201
 1.25154393e-101 1.10803158e-001]
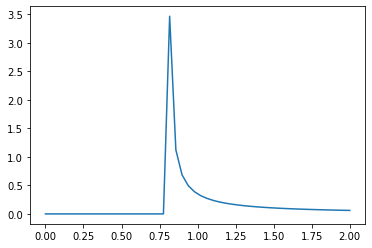
代码#3:图形表示。
import numpy as np
import matplotlib.pyplot as plt

distribution = np.linspace(0, np.minimum(rv.dist.b, 2))
print("Distribution : \n", distribution)
输出 :
Distribution :
 [0. 0. 0. 0. 0. 0. 0. 0. 0. 0. 0. 0. 0. 0. 0. 0. 0. 0. 0. 0. 0. 0. 0. 0.
 0. 0. 0. 0. 0. 0. 0. 0. 0. 0. 0. 0. 0. 0. 0. 0. 0. 0. 0. 0. 0. 0. 0. 0.
 0. 0.]

代码#4:改变位置参数
import matplotlib.pyplot as plt
import numpy as np

x = np.linspace(0, 5, 100)

# Varying positional arguments
y1 = weibull_max.pdf(x, a, b)
y2 = weibull_max.pdf(x, a, b)
plt.plot(x, y1, "*", x, y2, "r--")
输出 : 