问题1.您将使用直方图显示哪些数据?
(a)邮差包中不同区域的字母数。
(b)田径比赛中选手的身高。
(c)5家公司生产的盒带数量。
(d)从上午7:00到下午7:00在车站登车的乘客人数。
给出每个原因。
解决方案:
(b) The height of competitors in an athletics meet.
(d) The number of passengers boarding trains from 7:00 a.m. to 7:00 p.m. at a station.
Reason:
Histogram is a graphical representation of data when the data is represented using the class-interval, where class-interval is the numerical width of any class.
As the cases mentioned in the options (b) and (d) data can be divided into class-intervals, therefore histogram can be used for representing the data.
Whereas in the cases (a) and (c) the data can’t be divided into class-intervals, thus histogram can’t be used for representing the data.
问题2.来到百货商店的购物者被标记为:男人(M),女人(W),男孩(B)或女孩(G)。以下列表列出了在早上的第一个小时内到访的购物者:
WWWGBWWMGGMMWWWWGWGWBWB GGMWWMMWW
WMWBWGMWWWWGWMMWWMWGW MGWMMBGGW
使用提示标记制作频率分布表。画一个条形图来说明它。
解决方案:
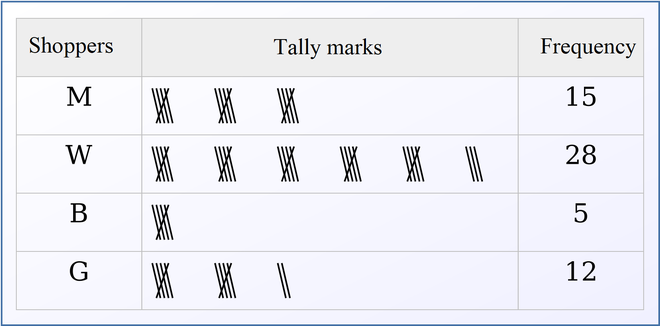
Frequency distribution table using tally marks:

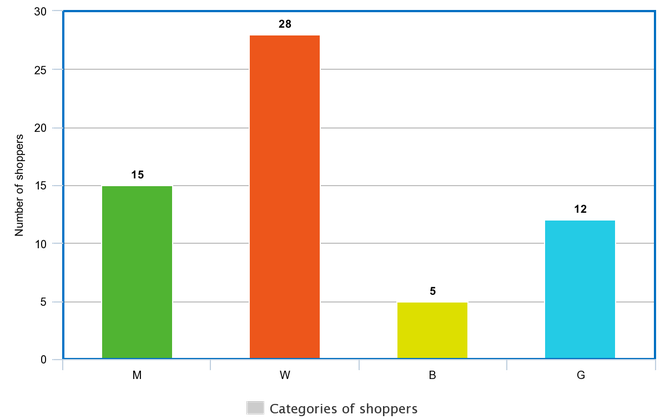
The bar graph to illustrate data:

问题3.工厂中30名工人的每周工资(以₹为单位)。
830、835、890、810、835、836、869、845、898、890、820、860、832、833、855、845,
804、808、812、840、885、835、835、836、878、840、868、890、806、840
使用计数标记可以制作频率表,其间隔为800–810、810–820,依此类推。
解决方案:
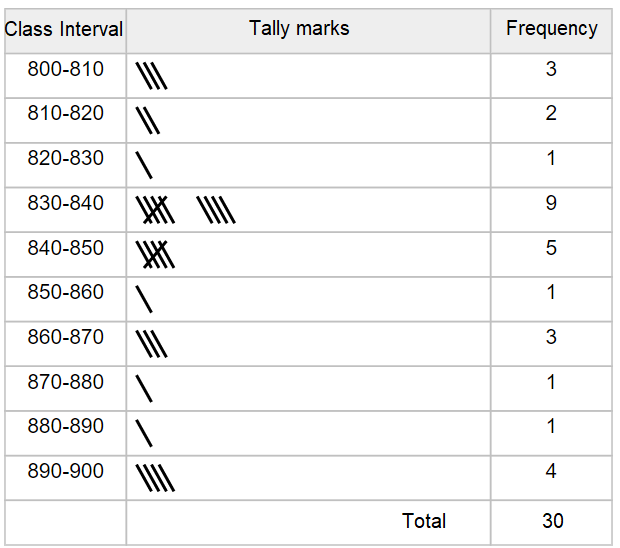
Frequency table with intervals as 800–810, 810–820 and so on using tally marks are given below:

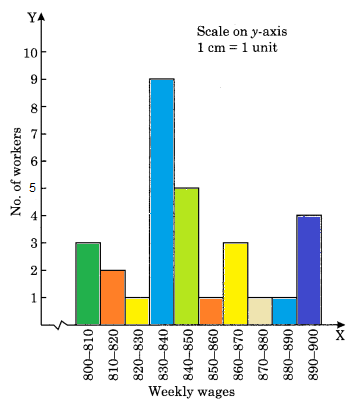
问题4.为频率表绘制一个直方图,该频率表是针对问题3中的数据制作的,并回答以下问题。
(i)哪一组工人人数最多?
(ii)多少工人能赚取₹850或更多?
(iii)有多少工人的收入低于₹850?
解决方案:

(i) Group 830-840 has the maximum number of workers working, i.e., 9.
Reason: When seeing the graph we can observe that group having weekly wage 830-840 there are 9 workers working.
(ii) 10 workers earn more than or equal to ₹ 850.
Reason: When seeing the graph we can observe that group having weekly wage more than or equal to ₹ 850, there are 10 workers working when we add all the workers having wage more than or equal to ₹ 850.
(iii) 20 workers earn less than ₹ 850.
Reason: When seeing the graph we can observe that group having weekly wage less than ₹ 850, there are 20 workers working when we add all the workers having wage less than ₹ 850.
问题5.通过给定的图表显示了特定班级的学生在假期里看电视的小时数。
回答以下问题:
(i)最多的学生看电视多少小时?
(ii)有多少学生看电视的时间少于4小时?
(iii)有多少学生花了5个小时以上的时间看电视?

解决方案:
(i) By observing the graph we can find that the maximum number of students i.e. 32 watched TV for 4 to 5 hours.
(ii) The students who watched TV for less than 4 hours are 34 students.
Reason:
Students who watch TV for 1-2 hours : 4
Students who watch TV for 2-3 hours : 8
Students who watch TV for 3-4 hours : 22
Therefore, the student who watched TV for less than 4 hours are 4+8+22 = 34
(iii) The students who watched TV for more than 5 hours are 14 students.
Reason:
Students who watch TV for 6-6 hours : 8
Students who watch TV for 6-7 hours : 6
Therefor the student who watched TV for more than 5 hours are 8+6 = 14