问题1.一个组织针对全球15至44岁(以年为单位)的妇女中的疾病和死亡原因进行的一项调查发现,以下数字(以%为单位):
| S.No. | Causes | Female fatality rate (%) |
| 1. | Reproductive health conditions | 31.8 |
| 2. | Neuropsychiatric conditions | 25.4 |
| 3. | Injuries | 12.4 |
| 4. | Cardiovascular conditions | 4.3 |
| 5. | Respiratory conditions | 4.1 |
| 6. | Other causes | 22.0 |
(i)以图形方式表示以上给出的信息。
(ii)全世界女性健康和死亡的主要原因是什么?
(iii)尝试在老师的帮助下找出在上述(ii)的原因中起主要作用的任何两个因素。
解决方案:
(i) The information given in the question can be represented graphically as:

(ii) It can be observed from the graph that the reproductive health conditions is the major cause of women’s ill health and death worldwide.
(iii) Two factors which play a major role in the cause in (ii) above being the major cause are:
- Lack of proper care and understanding.
- Lack of medical facilities.
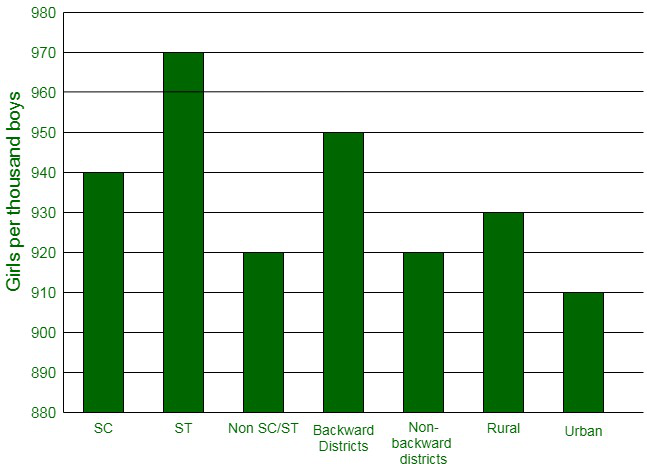
问题2.以下是印度社会不同阶层每千个男孩中的女孩数量(至最近的十个)的以下数据:
| S.No. | Section | Number of girls per thousand boys |
| 1. | Scheduled Caste (SC) | 940 |
| 2. | Scheduled Tribe (ST) | 970 |
| 3. | Non SC/ST | 920 |
| 4. | Backward districts | 950 |
| 5. | Non-backward districts | 920 |
| 6. | Rural | 930 |
| 7. | Urban | 910 |
(i)用条形图表示以上信息。
(ii)在课堂上讨论可以从图中得出哪些结论。
解决方案:
(i) The information given in the question can be represented graphically as:

(ii) The following conclusions can be made from the graph,
- The maximum number of girls per thousand boys is present in the section ST.
- The backward districts and rural areas have more number of girls per thousand boys than non-backward districts and urban areas.
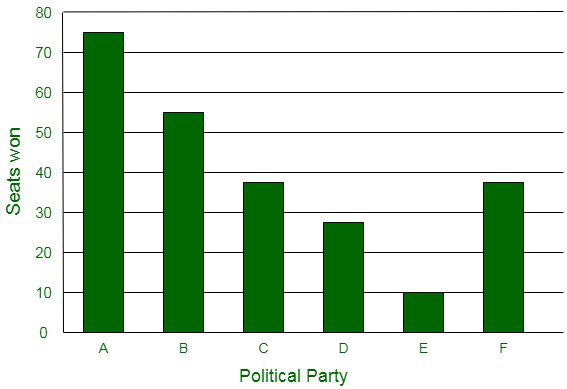
问题3.以下是各政党在州议会选举的投票结果中所获得的席位:
| Political party | A | B | C | D | E | F |
| Seats won | 75 | 55 | 37 | 29 | 10 | 37 |
(i)绘制条形图以表示轮询结果。
(ii)哪个政党赢得了最多席位?
解决方案:
(i) The bar graph representing the polling results is given below:

(ii) It can be easily visualized that Party A won the maximum number of seats.
问题4.测量一棵植物的40片叶子的长度正确到一毫米,下表中表示了获得的数据:
| S.No. | Length (in mm) | Number of leaves |
| 1. | 118 – 126 | 3 |
| 2. | 127 – 135 | 5 |
| 3. | 136 – 144 | 9 |
| 4. | 145 – 153 | 12 |
| 5. | 154 – 162 | 5 |
| 6. | 163 – 171 | 4 |
| 7. | 172 – 180 | 2 |
(i)绘制直方图以表示给定的数据。 [提示:首先使班级间隔连续进行]
(ii)对于同一数据,是否还有其他合适的图形表示形式?
(iii)得出最大叶片数为153毫米长的结论是否正确?为什么?
解决方案:
(i) The data given in the question is represented in discontinuous class interval. In order to make it in a continuous class interval., we subtract ½ = 0.5 from lower limit and add 0.5 to the upper limit. Then, the table becomes:

(ii) Yes, the data given in the question can also be represented in the form of a frequency polygon.
No, we cannot conclude that the maximum number of leaves are 153 mm long because the maximum number of leaves are lying in-between the length of 144.5 – 153.5
问题5.下表列出了400盏霓虹灯的使用寿命:
| S.No. | Length (in mm) | Number of leaves |
| 1. | 117.5 – 126.5 | 3 |
| 2. | 126.5 – 135.5 | 5 |
| 3. | 135.5 – 144.5 | 9 |
| 4. | 144.5 – 153.5 | 12 |
| 5. | 153.5 – 162.5 | 5 |
| 6. | 162.5 – 171.5 | 4 |
| 7. | 171.5 – 180.5 | 2 |
(i)借助直方图表示给定的信息。
(ii)多少灯的使用寿命超过700小时?
解决方案:
(i) The histogram representation of the given data is given below:

(ii) The total number of lamps having a lifetime of more than 700 hours = 74+62+48
= 184
问题6.下表根据两部分学生获得的分数给出了他们的分布情况:
| Life Time (in hours) | Number of lamps |
| 300 – 400 | 14 |
| 400 – 500 | 56 |
| 500 – 600 | 60 |
| 600 – 700 | 86 |
| 700 – 800 | 74 |
| 800 – 900 | 62 |
| 900 – 1000 | 48 |
用两个频率多边形表示同一图形上两个部分的学生标记。从两个多边形中比较两个部分的性能。
解决方案:
The class-marks = (lower limit + upper limit)/2
Section A:
Section B:
Representing these data on a graph using two frequency polygons we get,

Conclusively, the students of Section A performed better than Section B.
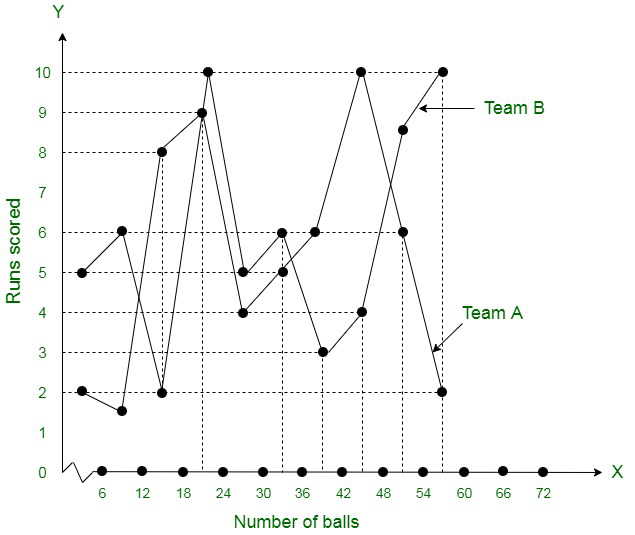
问题7.板球比赛的前60个球中,两支球队A和B得分得分如下:
|
Section A |
Section B |
||
|
Marks |
Frequency |
Marks |
Frequency |
|
0 – 10 |
3 |
0 – 10 |
5 |
|
10 – 20 |
9 |
10 – 20 |
19 |
|
20 – 30 |
17 |
20 – 30 |
15 |
|
30 – 40 |
12 |
30 – 40 |
10 |
|
40 – 50 |
9 |
40 – 50 |
1 |
通过频率多边形在同一张图上表示两个团队的数据。
[提示:首先使上课间隔连续。]
解决方案:
The data given in the question is represented in discontinuous class interval. In order to make it in continuous class interval, we subtract ½ = 0.5 = 0.5 from lower limit and add 0.5 to the upper limit. Then the table becomes:
| Number of balls | Team A | Team B |
| 0.5-6.5 | 2 | 5 |
| 6.5-12.5 | 1 | 6 |
| 12.5-18.5 | 8 | 2 |
| 18.5-24.5 | 9 | 10 |
| 24.5-30.5 | 4 | 5 |
| 30.5-36.5 | 5 | 6 |
| 36.5-42.5 | 6 | 3 |
| 42.5-48.5 | 10 | 4 |
| 48.5-54.5 | 6 | 8 |
| 54.5-60.5 | 2 | 10 |
The data of both the teams are represented on the graph below by frequency polygons.

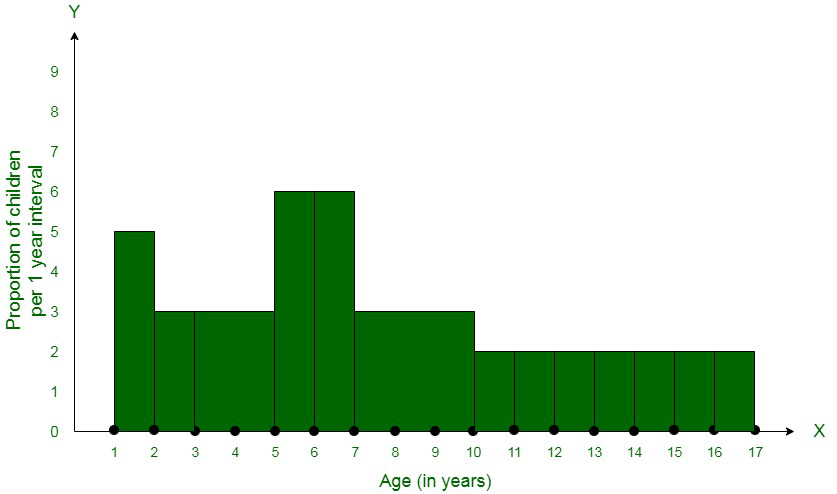
问题8.对在公园玩耍的各个年龄段的儿童人数进行了一次随机调查,结果如下:
| Marks | Class-marks | Frequency |
| 0-10 | 5 | 3 |
| 10-20 | 15 | 9 |
| 20-30 | 25 | 17 |
| 30-40 | 35 | 12 |
| 40-50 | 45 | 9 |
绘制直方图以表示上面的数据。
解决方案:
The width of the class intervals in the given data is varying in nature.
Also,
The area of rectangle is proportional to the frequencies in the histogram.
Now, the proportion of the children per year can be calculated as given in the table below.
|
Age (in years) |
Number of children (frequency) | Width of class | Length of rectangle |
| 1-2 | 5 | 1 | (5/1)×1 = 5 |
| 2-3 | 3 | 1 | (3/1)×1 = 3 |
| 3-5 | 6 | 2 | (6/2)×1 = 3 |
| 5-7 | 12 | 2 | (12/2)×1 = 6 |
| 7-10 | 9 | 3 | (9/3)×1 = 3 |
| 10-15 | 10 | 5 | (10/5)×1 = 2 |
| 15-17 | 4 | 2 | (4/2)×1 = 2 |
Let us assume,
x-axis = the age of children
y-axis = proportion of children per 1 year interval

问题9:从本地电话簿中随机抽取了100个姓,发现姓中英文字母的字母频率分布如下:
| Marks | Class-marks | Frequency |
| 0-10 | 5 | 5 |
| 10-20 | 15 | 19 |
| 20-30 | 25 | 15 |
| 30-40 | 35 | 10 |
| 40-50 | 45 | 1 |
(i)绘制直方图以描述给定的信息。
(ii)写下最大姓氏所在的班级间隔。
解决方案:
(i) The width of the class intervals in the given data is varying in nature.
Also,
The area of rectangle is proportional to the frequencies in the histogram.
Now, the proportion of the children per year can be calculated as given in the table below.
| Number of letters | Number of surnames | Width of class | Length of rectangle |
| 1-4 | 6 | 3 | (6/3)×2 = 4 |
| 4-6 | 30 | 2 | (30/2)×2 = 30 |
| 6-8 | 44 | 2 | (44/2)×2 = 44 |
| 8-12 | 16 | 4 | (16/4)×2 = 8 |
| 12-20 | 4 | 8 | (4/8)×2 = 1 |

(ii) 6-8 is the class interval in which the maximum number of surnames lie.