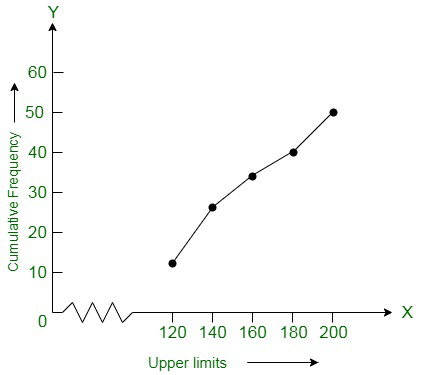
问题1.以下分配给出了如果有工厂,则每天有50名工人的日收入。将上面的分布转换为小于类型的累积频率分布,并绘制其形状。
| Daily income in Rupees | 100-120 | 120-140 | 140-160 | 160-180 | 180-200 |
| Number of workers | 12 | 14 | 8 | 6 | 10 |
解决方案:
According to the question, we convert the given distribution to a less than type cumulative frequency distribution,
Now according to the table we plot the points that are corresponding to the ordered pairs (120, 12), (140, 26), (160, 34), (180, 40), and (200, 50) on a graph paper. Here x-axis represents the upper limit and y-axis represent the frequency. The curve obtained from the graph is known as less than type ogive curve.

问题2:在对35名班级学生进行身体检查时,他们的体重记录如下:
| Daily income | Frequency | Cumulative Frequency |
| Less than 120 | 12 | 12 |
| Less than 140 | 14 | 26 |
| Less than 160 | 8 | 34 |
| Less than 180 | 6 | 40 |
| Less than 200 | 10 | 50 |
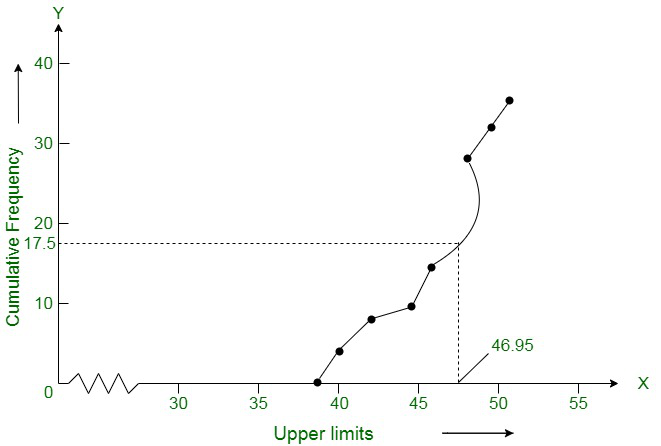
为给定数据绘制小于类型的ogive。因此,从图表中获取体重的中位数,并使用公式验证结果。
解决方案:
According to the give table, we get the points (38, 0), (40, 3), (42, 5), (44, 9), (46, 14), (48, 28), (50, 32) and (52, 35). Now using these points we draw an ogive, where the x-axis represents the upper limit and y-axis represents the frequency. The curve obtained is known as less than type ogive.

Now, locate the point 17.5 on the y-axis and draw a line parallel to the x-axis cutting the curve at a point. From this point, now we draw a perpendicular line to the x-axis and the intersection point which is perpendicular to x-axis is the median of the given data. After, locating point now we create a table to find the mode:
| Class interval | Number of students(Frequency) | Cumulative Frequency |
| Less than 38 | 0 | 0 |
| Less than 40 | 3 – 0 = 3 | 3 |
| Less than 42 | 5 – 3 = 2 | 8 |
| Less than 44 | 9 – 5 = 4 | 9 |
| Less than 46 | 14 – 9 = 5 | 14 |
| Less than 48 | 28 – 14 = 14 | 28 |
| Less than 50 | 32 – 28 = 4 | 32 |
| Less than 52 | 35 – 22 = 3 | 35 |
The class 46 – 48 has the maximum frequency, hence, this is the modal class
l = 46, h = 2, f1 = 14, f0 = 5 and f2 = 4
Now we find the mode:
Mode = ![]()
On substituting the values in the given formula, we get
= 46 + 0.95 = 46.95
Hence, the mode is verified.
问题3.下表列出了一个村庄的100个农场的每公顷小麦的产量。
| Weight in kg | Number of students |
| Less than 38 | 0 |
| Less than 40 | 3 |
| Less than 42 | 5 |
| Less than 44 | 9 |
| Less than 46 | 14 |
| Less than 48 | 28 |
| Less than 50 | 32 |
| Less than 52 | 35 |
将分布更改为多于类型的分布,并绘制其外观。
解决方案:
According to the question, we change the distribution to a more than type distribution.
| Production Yield (kg/ha) | Number of farms |
| More than or equal to 50 | 100 |
| More than or equal to 55 | 100 – 2 = 98 |
| More than or equal to 60 | 98 – 8 = 90 |
| More than or equal to 65 | 90 – 12 = 78 |
| More than or equal to 70 | 78 – 24 = 54 |
| More than or equal to 75 | 54 – 38 = 16 |
Now, according to the table we draw the ogive by plotting the points. Here, the a-axis represents the upper limit and y-axis represents the cumulative frequency. And the points are(50, 100), (55, 98), (60, 90), (65, 78), (70, 54) and (75, 16) on this graph paper. The graph obtained is known as more than type ogive curve.
