问题1.解释条形图的阅读和解释。
解决方案:
A bar graph comprises a sequence of vertical or horizontal bar lines, also known as rectangles which may be either horizontal or vertical in nature. It is used to simulate the collection of the information over a period of time. Also, it concludes various observations over a time frame from a given bar graph to specify interpretation of the bar graph.
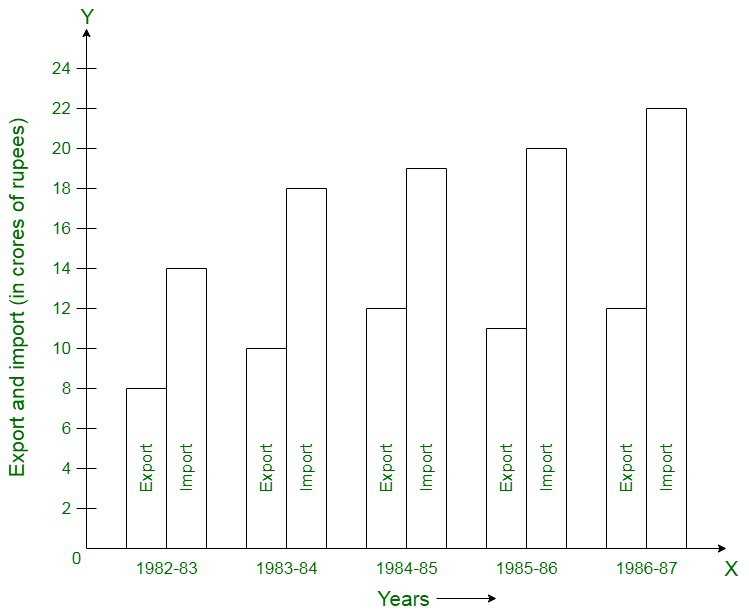
问题2.阅读以下条形图并回答以下问题:
(i)条形图提供了哪些信息?
(ii)哪一年的出口量最少?
(iii)哪一年进口最多?
(iv)哪一年的进出口值之差最大?

解决方案:
(i) The specified bar graph depicts the import and export (specified in 100 Crores of rupees) from 1982-83 to 1986-87.
(ii) 1982-83
(iii) 1986-87
(iv) 1986-87
问题3.下面的条形图显示了中学的年度考试结果。阅读下面给出的条形图,然后在以下每个选项中选择正确的替代方法:

(i)男孩和女孩的成绩成反比的一对班级是:
(a)VI,VIII(b)VI,IX(c)VII,IX(d)VIII,X
(ii)女生失败率最低的班级是:
(a)六(b)十(c)九(d)八
(iii)学生通过率最低的班级是:
(a)六(b)七(c)八(d)九
解决方案:
(i) Here, the option (b) is correct.
(ii) Here, the option (a) is correct.
(iii) Here, the option (b) is correct.
The sum of the corresponding heights of the bars for boys and girls in class VII = 95 + 40 = 135 [minimum]
问题4.以下数据给出了1995-2000年间在职业介绍所注册的申请人数量(千人):
| Year | 1995 | 1996 | 1997 | 1998 | 1999 | 2000 |
|
Number of applicants registered (in thousands) |
18 | 20 | 24 | 28 | 30 | 34 |
构造一个条形图以表示上述数据。
解决方案:
The following bar graph represents the bars where the horizontal and vertical axes represent the years and the number of applicants registered (in thousands) respectively.

问题5. 1999年我国一些钢铁厂的可销售钢材产量如下:
| Plant | Bhilai | Durgapur | Rourkela | Bokaro |
| Production (in thousands) | 160 | 80 | 200 | 150 |
通过使用1大刻度= 2万吨的比例,构建条形图以在方格纸上表示上述数据。
解决方案:
The following bar graph represents the bars where the horizontal and vertical axes represent the plants and the production in a thousand tonnes respectively.

问题6.下表给出了印度铁路几年中的路线长度(以一千公里为单位):
| Year | 1960-61 | 1970-71 | 1980-81 | 1990-91 | 2000-2001 |
|
Route length (in a thousand km) |
56 | 60 | 61 | 74 | 98 |
借助条形图表示上述数据。
解决方案:
The following bar graph represents the bars where the horizontal and vertical axes represent the years and the route lengths in a thousand km respectively.

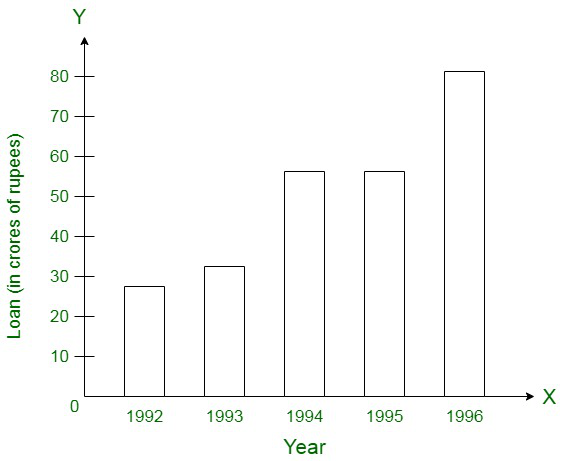
问题7.以下数据给出了某年银行支付的贷款额(以卢比计):
| Year | 1992 | 1993 | 1994 | 1995 | 1996 |
|
Loan (in crore of rupees) |
28 | 33 | 55 | 55 | 80 |
(i)借助条形图表示上述数据。
(ii)在条形图的帮助下,指出贷款额不比上一年增加的年份。
解决方案:
(i)

(ii) In 995, the loan is not increased over that period of the preceding year.
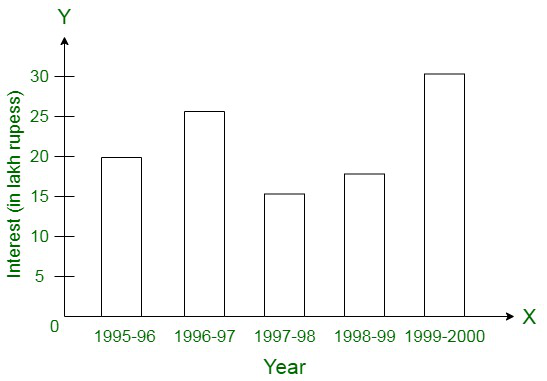
问题8.下表显示了公司支付的利息(十万卢比):
| Year | 1995-96 | 1996-97 | 1997-98 | 1998-99 | 1999-2000 |
|
Interest (in lakhs of rupees) |
20 | 25 | 15 | 18 | 30 |
绘制条形图代表上述信息。
解决方案:
The following bar graph represents the bars where the horizontal and vertical axes represent the years and the interest amount in lakhs respectively.

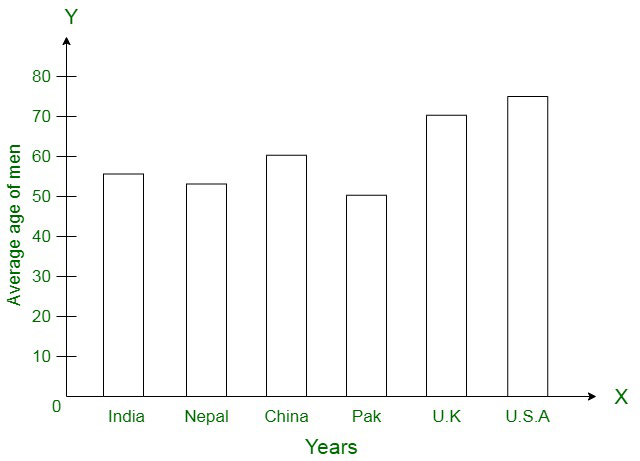
问题9.以下数据显示了特定年份中各个国家的男性平均年龄:
| Country | India | Nepal | China | Pakistan | U.K. | U.S.A |
|
Average age (in years) |
55 | 52 | 60 | 50 | 70 | 75 |
用条形图表示以上信息。
解决方案:
The following bar graph represents the bars where the horizontal and vertical axes represent the countries and the average age(in years) respectively.

问题10.以下数据给出了一些年份的粮食产量(千吨):
| Year | 1995 | 1996 | 1997 | 1998 | 1999 | 2000 |
| Production (in a thousand tonnes) | 120 | 150 | 140 | 180 | 170 | 190 |
借助条形图表示上述数据。
解决方案:
The following bar graph represents the bars where the horizontal and vertical axes represent the years and the production (in a thousand tonnes) respectively.
