问题11.以下数据给出了某公司几年内制造的粪便量(千吨):
| Year | 1992 | 1993 | 1994 | 1995 | 1996 | 1997 |
|
Manure (in thousand tonnes) |
15 | 35 | 45 | 30 | 40 | 20 |
(i)借助条形图表示上述数据。
(ii)在条形图的帮助下指出公司制造的粪便量最大的年份。
(输入)选择正确的替代方法:
粪肥产量出现最大下降的连续年份是:
(a)1994年和1995年
(b)1992年及1993年
(c)1996年和1997年
(d)1995年和1996年
解决方案:
(i) The following bar graph represents information in the form of horizontal axes and vertical axes representing years and manure (in thousand tonnes) respectively.
(ii) The maximum amount of manure manufactured was 45 thousand tonnes produced in the year 1994.

(iii) The maximum decrease in manure production was witnessed from the year 1996 to 1997.
问题12.以下数据给出了印度政府电子部对第八个计划时期(1990-95年)中计算机领域人员的需求估计:
| Qualifications |
MCA (Master in Computer Applications) |
DCA (Diploma in Computer Applications) |
DCE (Diploma in Computer Engineering) |
CL (Certificate Level Course) |
ST (Short-term course) |
| Personnel Required | 40600 | 181600 | 18600 | 670600 | 1802900 |
借助条形图表示数据。借助条形图指示估计需求最少的过程。
解决方案:
The following bar graph represents information in the form of horizontal axes and vertical axes representing qualifications and personnel required respectively. The course where requirement expected least is DCE.
问题13.以下数据提供了一个家庭5年的收入和支出:
| Years | 1995-96 | 1996-97 | 1997-98 | 1998-99 | 1999-2000 |
| Income (rs in thousands) | 100 | 140 | 150 | 170 | 210 |
| Expenditure (rs in thousands) | 80 | 130 | 145 | 160 | 190 |
用条形图表示以上数据。
解决方案:

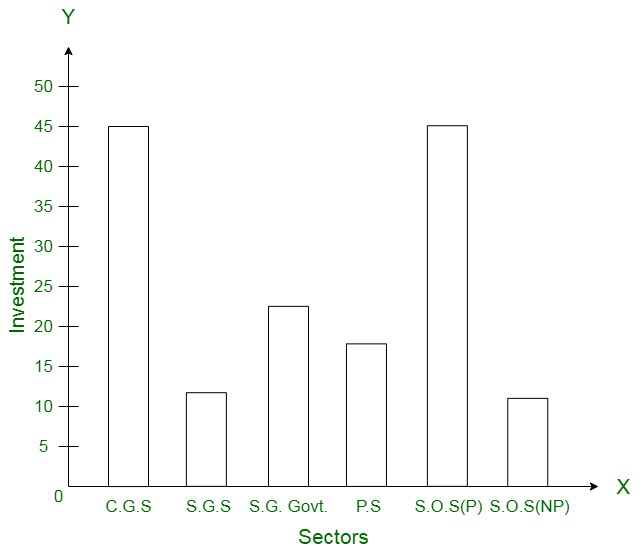
问题14.印度人寿保险公司在不同领域的投资(以十亿卢比计)如下:
| Sectors |
Investment (in ten crores of rupees) |
| Central Government Securities | 45 |
| State Government Securities | 11 |
| Securities guaranteed by the govt. | 23 |
| Private Sectors | 18 |
| Socially oriented sectors (Plan) | 46 |
| Socially oriented sectors (Non-plan) | 11 |
借助条形图表示上述数据。
解决方案:
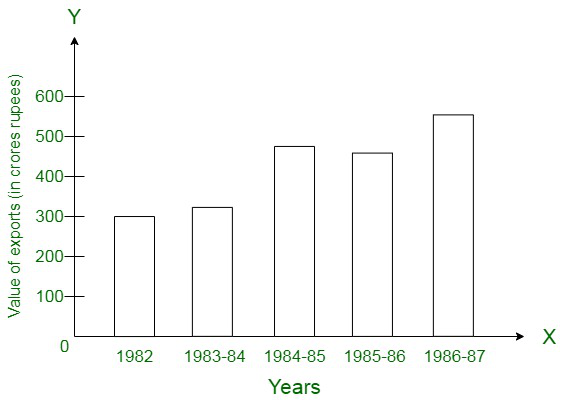
问题15.以下数据给出了不同年份印度棉纺织品出口的价值(卢比):
| Years | 1982 | 1983-84 | 1984-85 | 1985-86 | 1986-87 |
|
Value of exports of cotton textiles (in crore of rupees) |
300 | 325 | 475 | 450 | 550 |
借助条形图表示上述数据。借助条形图指示上一年的出口增长率最大的年份。
解决方案:
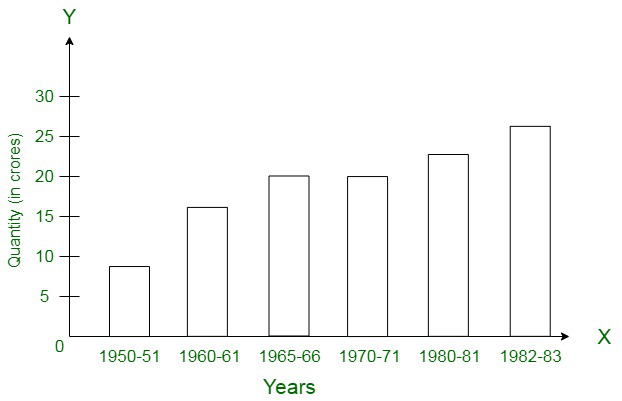
问题16.下表给出了货物数量(以吨为单位)
| Year | 1950-51 | 1960-61 | 1965-66 | 1970-71 | 1980-81 | 1982-83 |
|
Quantity of Goods (in crore tonnes) |
9 | 16 | 20 | 20 | 22 | 26 |
借助条形图表示此信息。
通过条形图说明印度铁路公司在1965-66年间运载的货物数量是否比1950-51年间运载的货物数量多一倍。
解决方案:
问题17:1982年印度一些炼油厂的石油产量(十万吨)如下:
| Refinery | Barauni | Koyali | Mathura | Mumbai | Florida |
|
Production in oil (in lakh tonnes) |
30 | 70 | 40 | 45 | 25 |
构造一个表示上述数据的条形图,以便水平绘制这些条形。
解决方案:

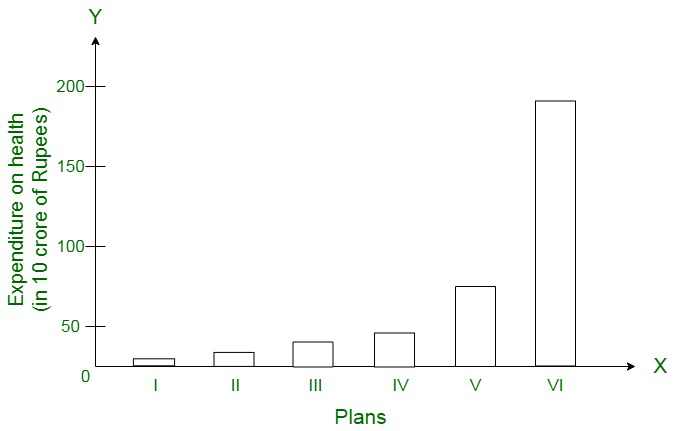
问题18.印度政府在各个五年计划期间在卫生方面的支出(以1亿卢比计)如下:
| Plans | I | II | III | IV | V | VI |
|
Expenditure on health (in 10 crores of rupees) |
7 | 14 | 23 | 34 | 76 | 182 |
构造一个条形图以表示上述数据。
解决方案: