问题11.阅读以下条形图并回答以下问题:

(i)条形图提供了哪些信息?
(ii)1980-81年间水泥的产量是多少?
(iii)水泥和相应年份的最小和最大产量是多少?
解决方案:
(i) The bar graph depicts the industrial production of cement in different years in India.
(ii) The production of cement in the year 1980-81 was 186 lakh tonnes.
(iii) Minimum production of cement was 30 lakh tonnes in 1950-51 and maximum production was 232 lakh tonnes in 1982-83 respectively.
问题12.图中的条形图代表10种语言的报纸发行量。研究条形图并回答以下问题:

(i)以印地语,英语,乌尔都语,旁遮普语和孟加拉语出版的报纸总数是多少?
(ii)在印地语中,报纸总数占总数的百分之几?
(iii)找出用英文出版的报纸数量多于用乌尔都语出版的报纸数量,
(iv)命名两对出版相同数量报纸的语言。
(v)陈述最少报纸数量的语言。
(vi)说明出版报纸数量最多的语言。
(vii)注明出版的报纸数量在2500至3500之间的语言。
(viii)陈述是非题:
(a)在马拉雅拉姆语和马拉地语中一起出版的报纸数量少于以英语出版的报纸数量。
(b)泰卢固语出版的报纸数量多于泰米尔语出版的报纸数量。
解决方案:
(i) The total number of newspapers published in Hindi, English, Urdu, Punjabi, and Bengali are
= 3700 + 3400 + 700 + 200 + 1100 = 9100
(ii) The percent is the number of newspapers published in Hindi of the total number of newspapers
= (3700 * 100)/14400 = 25.69%
(iii) The excess of the number of newspapers published in English over those published in Urdu = Difference in English and Urdu = 3400 – 700 = 2700
(iv) Two pairs of languages which publish the same number of newspapers are Malayalam and Marathi, Bengali and Gujrati
(v) The language in which the smallest number of newspapers are published is Punjabi (200)
(vi) The language in which the largest number of newspapers are published is Hindi (3700)
(vii) The language in which the number of newspapers published is between 2500 and 3500 is English (3400)
(viii) (a) True (b) False
问题13.阅读图中给出的条形图,并回答以下问题:

(i)条形图提供了哪些信息?
(ii)如果在1970-71年间种植水稻,作物的产量是多少?
(iii)水稻的最大产量与最小产量有何区别?
解决方案:
(i) The bar graph illustrates the production of rice in India during different years.
(ii) Crop production of rice in 1970-71 was 42.5 lakh tonnes.
(iii) Differences in maximum and minimum production of rice is equivalent to 55 – 22 lakh tonnes = 33 lakh tonnes
问题14.阅读图中给出的条形图,并回答以下问题:

(i)它提供什么信息?
(ii)1980年教育开支的哪一部分最大?
(iii)从1980年到1990年,支出的哪一部分增加了?
(iv)1980年和1990年之间的哪一部分差距最大?
解决方案:
(i) The bar graph illustrates the public expenditure spent on education by vertices sub-continents in 1980 and 1990.
(ii) The expenditure on education is maximum in 1980 in Africa.
(iii) The expenditure from 1980 to 1990 was gone up in the continent of East Africa.
(iv) Maximum gap between 1980 and 1990 was witnessed in the continent of Africa.
问题15.阅读图中给出的条形图,并回答以下问题:

(i)条形图提供了哪些信息?
(ii)哪一年甘蔗作物的面积最大和最小?
(iii)陈述是非题:
1982-83年甘蔗种植面积是1950-51年的三倍。
解决方案:
(i) The bar graph gives us information about the areas under sugarcane crop during different years in India.
(ii) Maximum sugarcane crop was witnessed in the years 1982-83 and minimum in 1950-51 respectively.
(iii) The given statement is false, because the area under the sugarcane crop in the year 1982-83 is nearly 2.5 times that of the year 1950-51.
问题16.阅读图中给出的条形图,并回答以下问题:

(i)条形图提供了哪些信息?
(ii)1982-83年度在卫生和计划生育方面的支出是多少?
(iii)哪一年的最高支出增加额超过上一年的支出?最大增加额是多少?
解决方案:
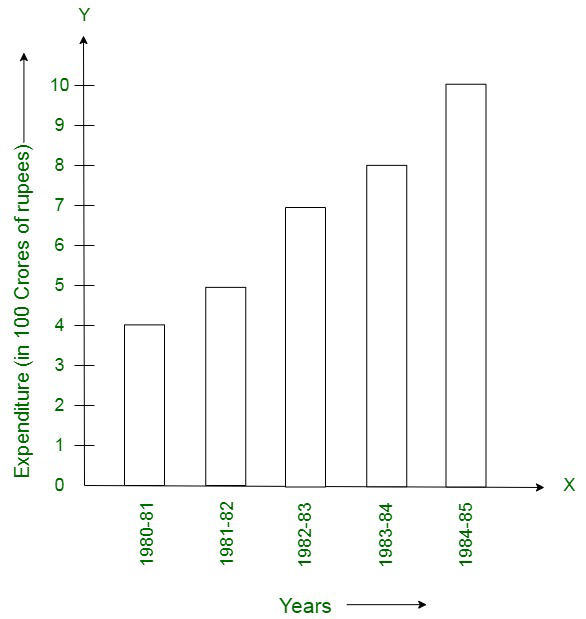
(i) The bar graph shows the expenditure on health and family planning during sixth five-year plan in India.
(ii) The expenditure on health and family planning in the year 1982-83 was 700 crore rupees.
(iii) Maximum increase was noticed in the year 1984-85 with a difference 10.2 – 8 = 220 crores during the successive years.
问题17.阅读图中给出的条形图,并回答以下问题:
(i)条形图给出的信息是什么?
(ii)有6名成员的家庭有多少?
(iii)每个家庭最多有多少个成员?还要告诉你这样的家庭数量。
(iv)家庭数量相等的每个家庭有多少成员?还有,请问有多少这样的家庭?

解决方案:
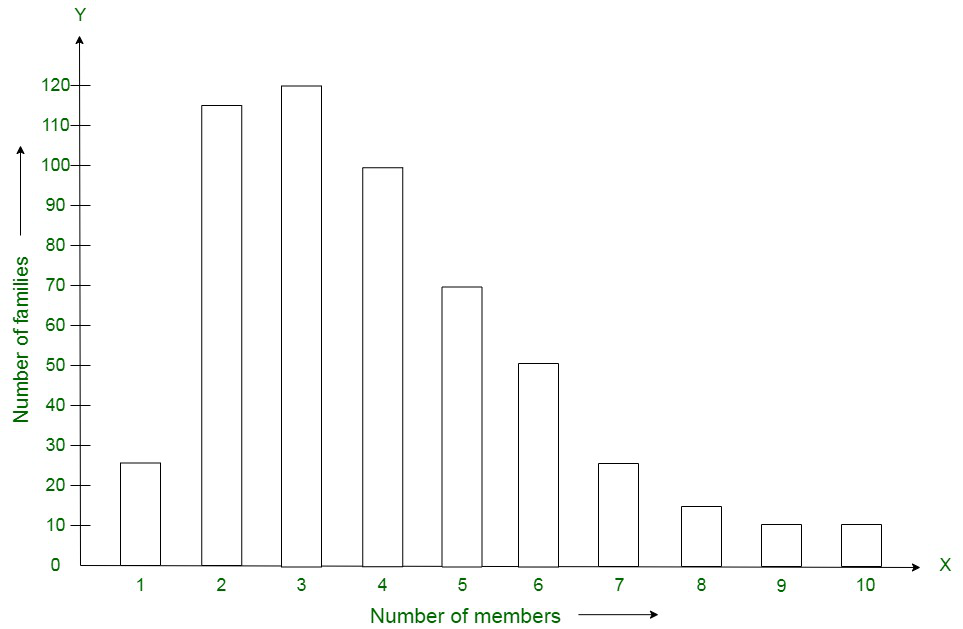
(i) The bar graph shows the number of families with different number of members in a locality.
(ii) Number of families having 6 members is equivalent to 50.
(iii) There are a maximum of 150 families with 3 members each.
(iv) There are 5 families each with 9 members and 10 members respectively.
问题18.阅读图中给出的条形图,并回答以下问题:

(i)条形图提供了哪些信息?
(ii)哪个门达尔山中心可以覆盖最大面积?还要告诉覆盖区域。
(iii)德里中心和孟买中心所覆盖的区域之间有什么区别?
(iv)哪个Doordarshan中心处于UP状态?他们覆盖哪些领域?
解决方案:
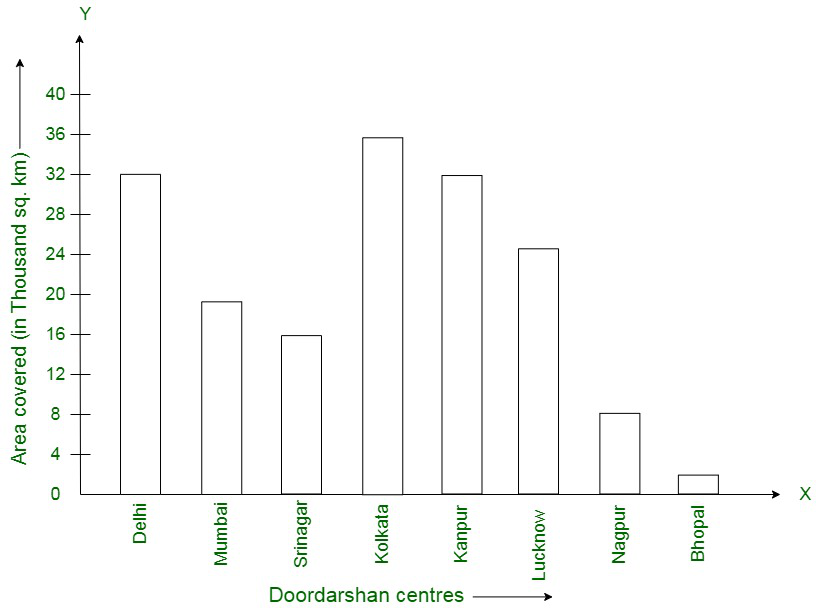
(i) The bar graph illustrates the coverage of certain Doordarshan centres in India.
(ii) The maximum area is of the Doordarshan kendra Kolkata which is equivalent to 36000 sq. km.
(iii) The difference between the areas covered by the Centre at Delhi and Bombay is equivalent to 32000 – 18000 = 14000 sq. km.
(iv) Doordarshan Centre in U.P. State are Kanpur (32000 sq. km) and Lucknow (25000 sq. km).