📌 相关文章
- R二项式分布(1)
- R-二项式分布
- Python二项式分布(1)
- Python二项式分布
- 统计-二项式分布(1)
- 统计-二项式分布
- 二项式堆(1)
- 二项式堆
- 数学 |概率分布集 4(二项式分布)(1)
- 数学 |概率分布集 4(二项式分布)(1)
- 数学 |概率分布集 4(二项式分布)
- 数学 |概率分布集 4(二项式分布)
- 二项式随机变量和二项式分布–概率| 12年级数学
- 二项式随机变量和二项式分布–概率| 12年级数学(1)
- Python – 统计中的负二项式离散分布
- Python – 统计中的负二项式离散分布(1)
- R 中的逆 t 分布(1)
- R 中的逆 t 分布
- 二项式堆的实现
- 伯努利试验和二项式分布–概率(1)
- 伯努利试验和二项式分布–概率
- 二项式堆实现java代码示例
- 二项式定理
- 二项式定理(1)
- 实现二项式堆的Java程序(1)
- 实现二项式堆的Java程序
- 在 R 中绘制 t 分布(1)
- 在 R 中绘制 t 分布
- 二项式系数之和
📜 R二项式分布
📅 最后修改于: 2021-01-08 10:07:05 🧑 作者: Mango
二项分布
二项式分布也称为离散概率分布,用于发现事件成功的概率。在一系列实验中,该事件只有两个可能的结果。抛硬币是二项式分布的最好例子。抛硬币时,它的正面或反面都可以。在二项式分布过程中,发现将三枚硬币反复抛十次时恰好找到三个正头的可能性是近似的。
R允许我们通过提供以下函数来创建二项式分布:

这些函数可以具有以下参数:
| S.No | Parameter | Description |
|---|---|---|
| 1. | x | It is a vector of numbers. |
| 2. | p | It is a vector of probabilities. |
| 3. | n | It is a vector of observations. |
| 4. | size | It is the number of trials. |
| 5. | prob | It is the probability of the success of each trial. |
让我们开始在示例的帮助下了解如何使用这些功能
dbinom():直接查找,点
R的dbinom()函数计算每个点的概率密度分布。简而言之,它计算特定二项式分布的密度函数。
例
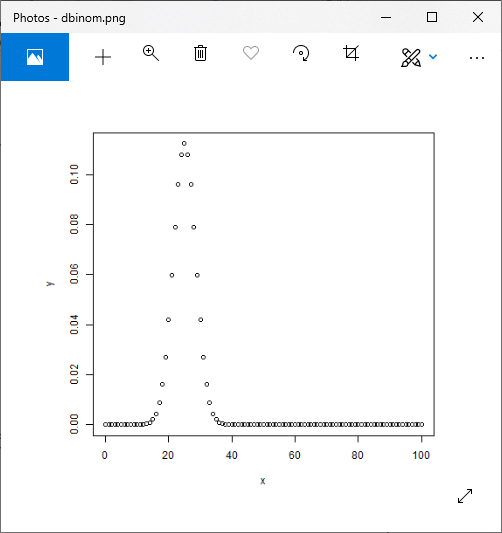
# Creating a sample of 100 numbers which are incremented by 1.5.
x <- seq(0,100,by = 1)
# Creating the binomial distribution.
y <- dbinom(x,50,0.5)
# Giving a name to the chart file.
png(file = "dbinom.png")
# Plotting the graph.
plot(x,y)
# Saving the file.
dev.off()
输出:
pbinom():直接查找,间隔
R的dbinom()函数计算事件的累积概率(表示概率的单个值)。简而言之,它计算特定二项式分布的累积分布函数。
例
# Probability of getting 20 or fewer heads from 48 tosses of a coin.
x <- pbinom(20,48,0.5)
#Showing output
print(x)
输出:

qbinom():反向查找
R的qbinom()函数获取概率值,并生成一个其累加值与概率值匹配的数字。简而言之,它计算二项式分布的逆累积分布函数。
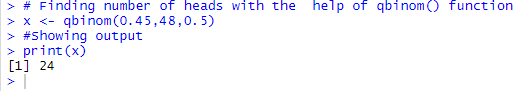
我们来看看掷硬币51次时机头的概率为0.45。
例
# Finding number of heads with the  help of qbinom() function
x <- qbinom(0.45,48,0.5)
#Showing output
print(x)
输出:
rbinom()
R的rbinom()函数用于从给定样本中为给定概率生成所需数量的随机值。
让我们看一个示例,在该示例中,我们从160个样本中发现9个随机值,概率为0.5。
例
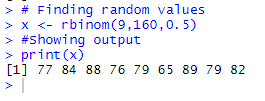
# Finding random values
x <- rbinom(9,160,0.5)
#Showing output
print(x)
输出: